10
10peptides
spectra
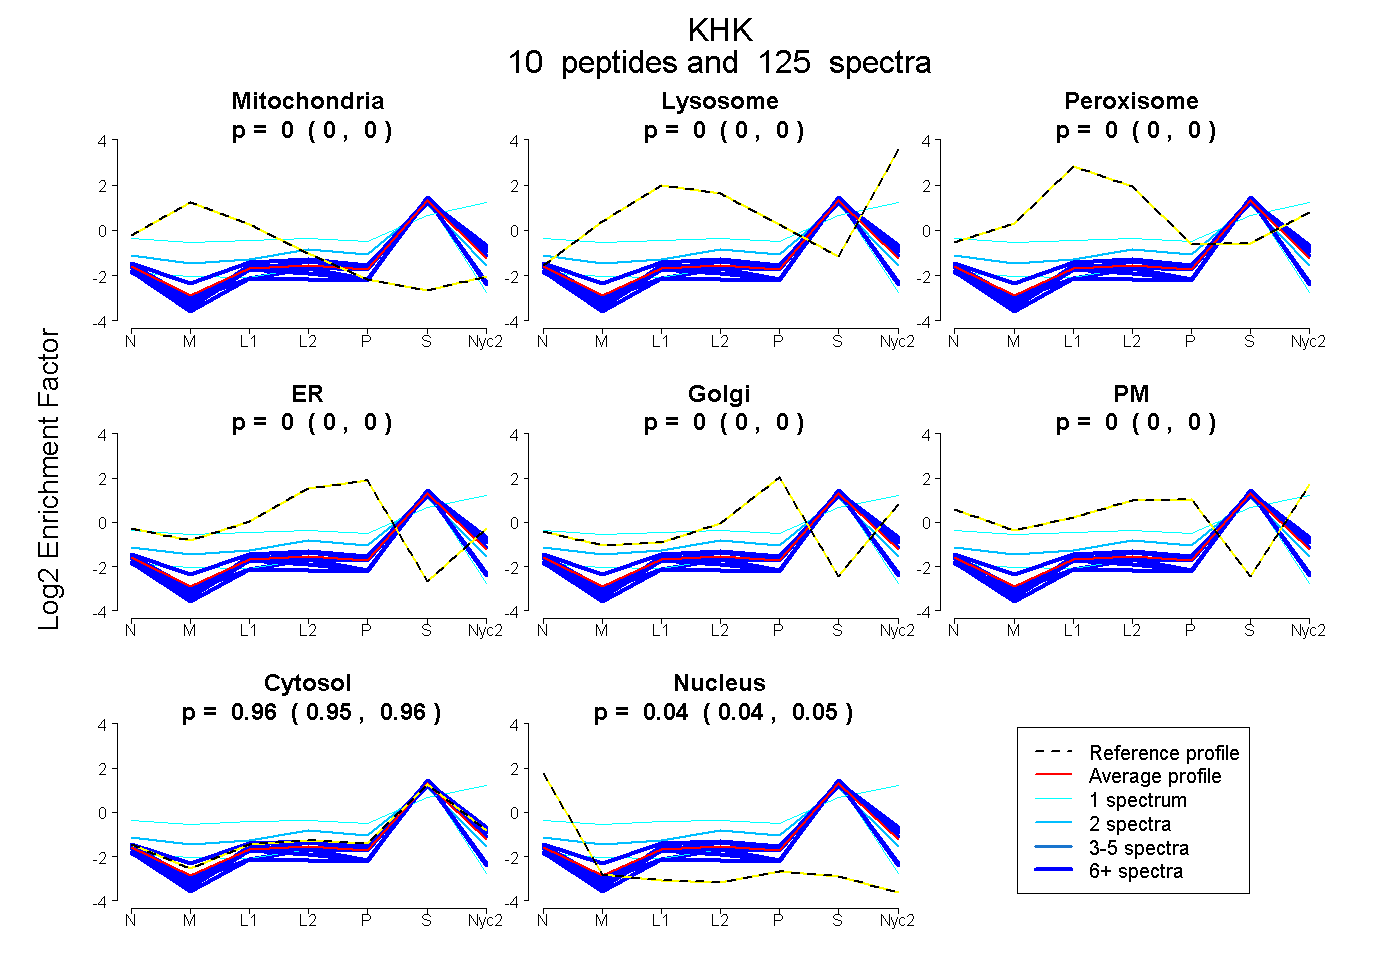
0.000 | 0.000
0.000 | 0.000
0.000 | 0.000
0.000 | 0.000
0.000 | 0.000
0.000 | 0.000
0.953 | 0.960
0.039 | 0.047
5peptides
spectra
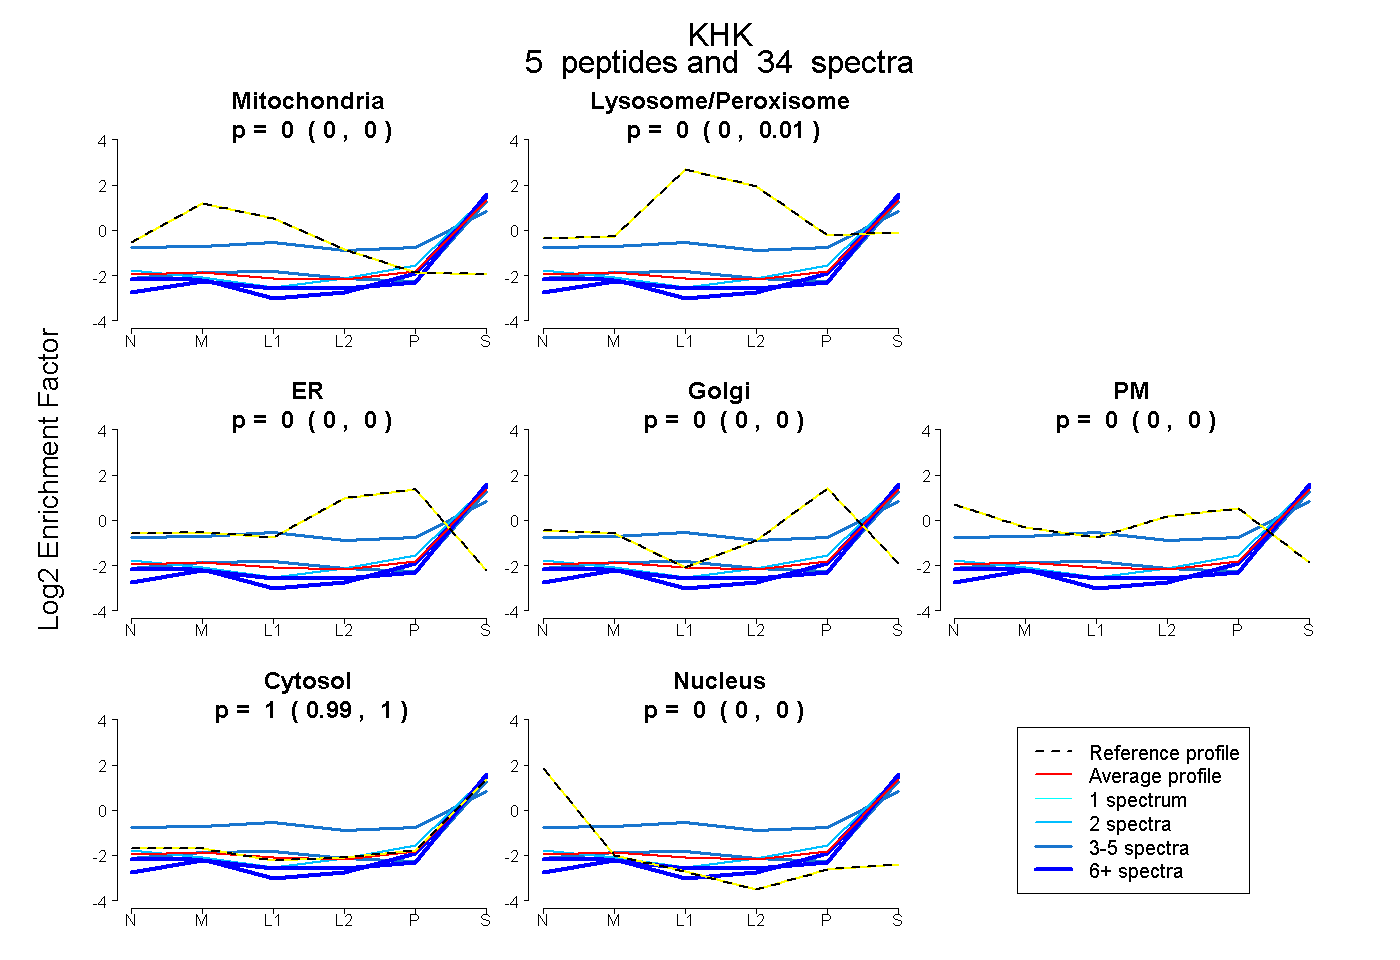
0.000 | 0.000
0.000 | 0.007
0.000 | 0.000
0.000 | 0.000
0.000 | 0.000
0.991 | 1.000
0.000 | 0.000