 10
10peptides
spectra
0.000 | 0.000
0.000 | 0.000
0.000 | 0.000
0.000 | 0.000
0.000 | 0.000
0.000 | 0.000
0.953 | 0.960
0.039 | 0.047
| Plot | Mito | Lyso | Perox | ER | Golgi | PM | Cytosol | Nucleus | |||||
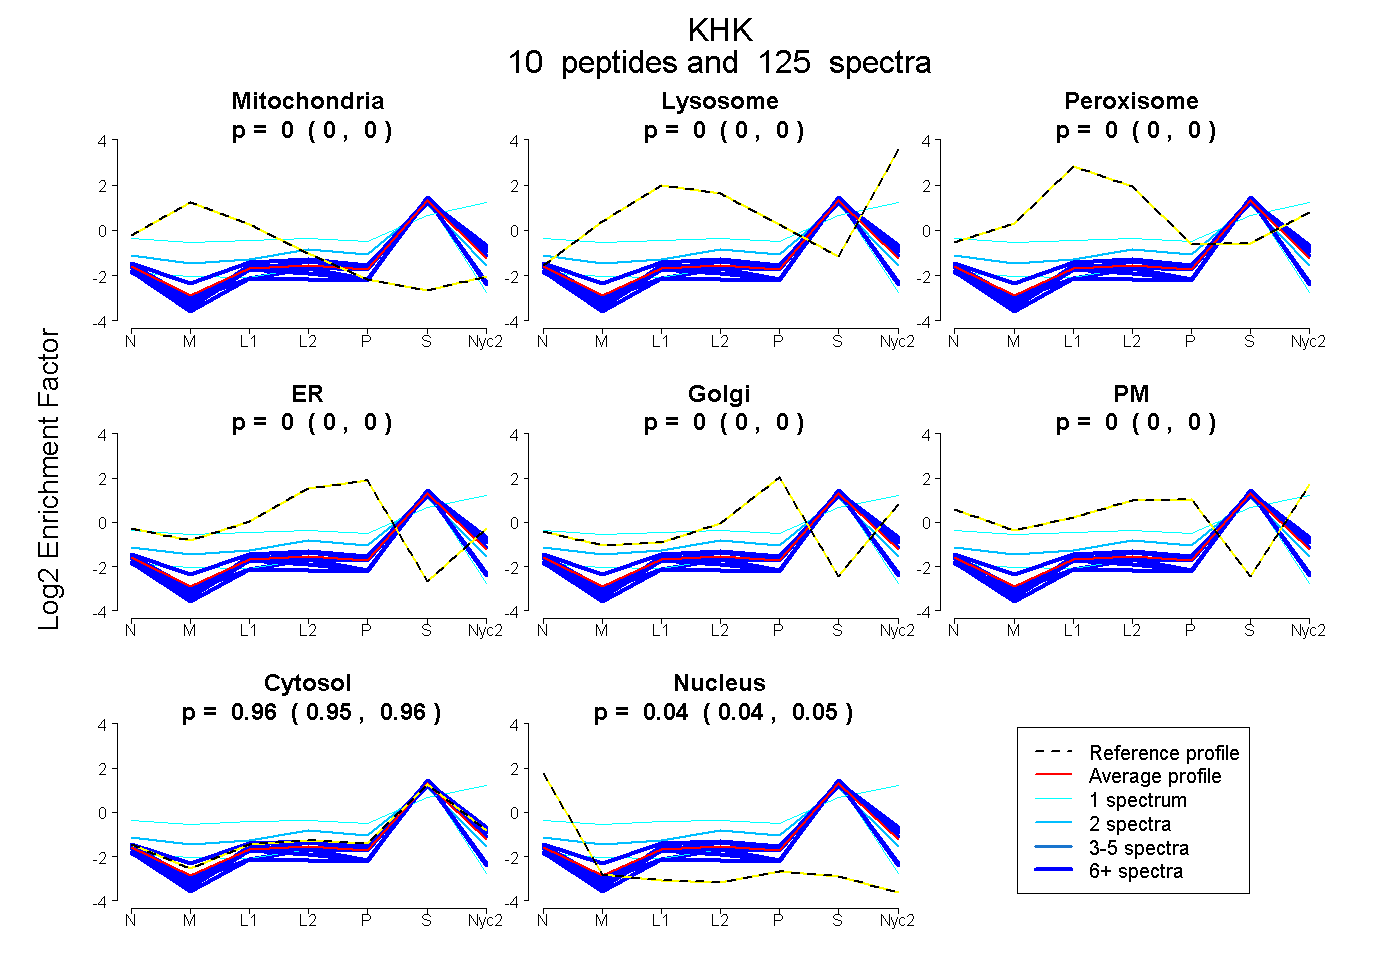
| Expt A |
10 peptides |
125 spectra |
|
0.000 0.000 | 0.000 |
0.000 0.000 | 0.000 |
0.000 0.000 | 0.000 |
0.000 0.000 | 0.000 |
0.000 0.000 | 0.000 |
0.000 0.000 | 0.000 |
0.957 0.953 | 0.960 |
0.043 0.039 | 0.047 |
| 10 spectra, SAGEALK | 0.000 | 0.000 | 0.000 | 0.000 | 0.000 | 0.000 | 0.978 | 0.022 | ||
| 6 spectra, VSVEIEKPR | 0.000 | 0.000 | 0.000 | 0.000 | 0.000 | 0.000 | 0.933 | 0.067 | ||
| 1 spectrum, GATLICAWAEEGADALGPDGQLLHSDAFPPPR | 0.000 | 0.000 | 0.000 | 0.000 | 0.000 | 0.000 | 0.867 | 0.133 | ||
| 15 spectra, NASEQVK | 0.000 | 0.000 | 0.000 | 0.000 | 0.000 | 0.000 | 0.998 | 0.002 | ||
| 1 spectrum, IEQYNATQPLQQK | 0.000 | 0.289 | 0.000 | 0.000 | 0.000 | 0.175 | 0.536 | 0.000 | ||
| 6 spectra, GGNASNSCTVLSLLGAR | 0.000 | 0.000 | 0.000 | 0.000 | 0.000 | 0.000 | 0.883 | 0.117 | ||
| 2 spectra, CGLQGFDGIV | 0.136 | 0.000 | 0.003 | 0.040 | 0.000 | 0.000 | 0.820 | 0.000 | ||
| 34 spectra, WIHIEGR | 0.030 | 0.000 | 0.000 | 0.000 | 0.000 | 0.000 | 0.970 | 0.000 | ||
| 7 spectra, FGCQVAGK | 0.000 | 0.000 | 0.000 | 0.000 | 0.000 | 0.000 | 0.874 | 0.126 | ||
| 43 spectra, GNSMQEALR | 0.000 | 0.000 | 0.000 | 0.000 | 0.000 | 0.000 | 0.993 | 0.007 |
| Plot | Mito | Lyso or Perox | ER | Golgi | PM | Cytosol | Nucleus | ||||||
| Expt B |
5 peptides |
34 spectra |
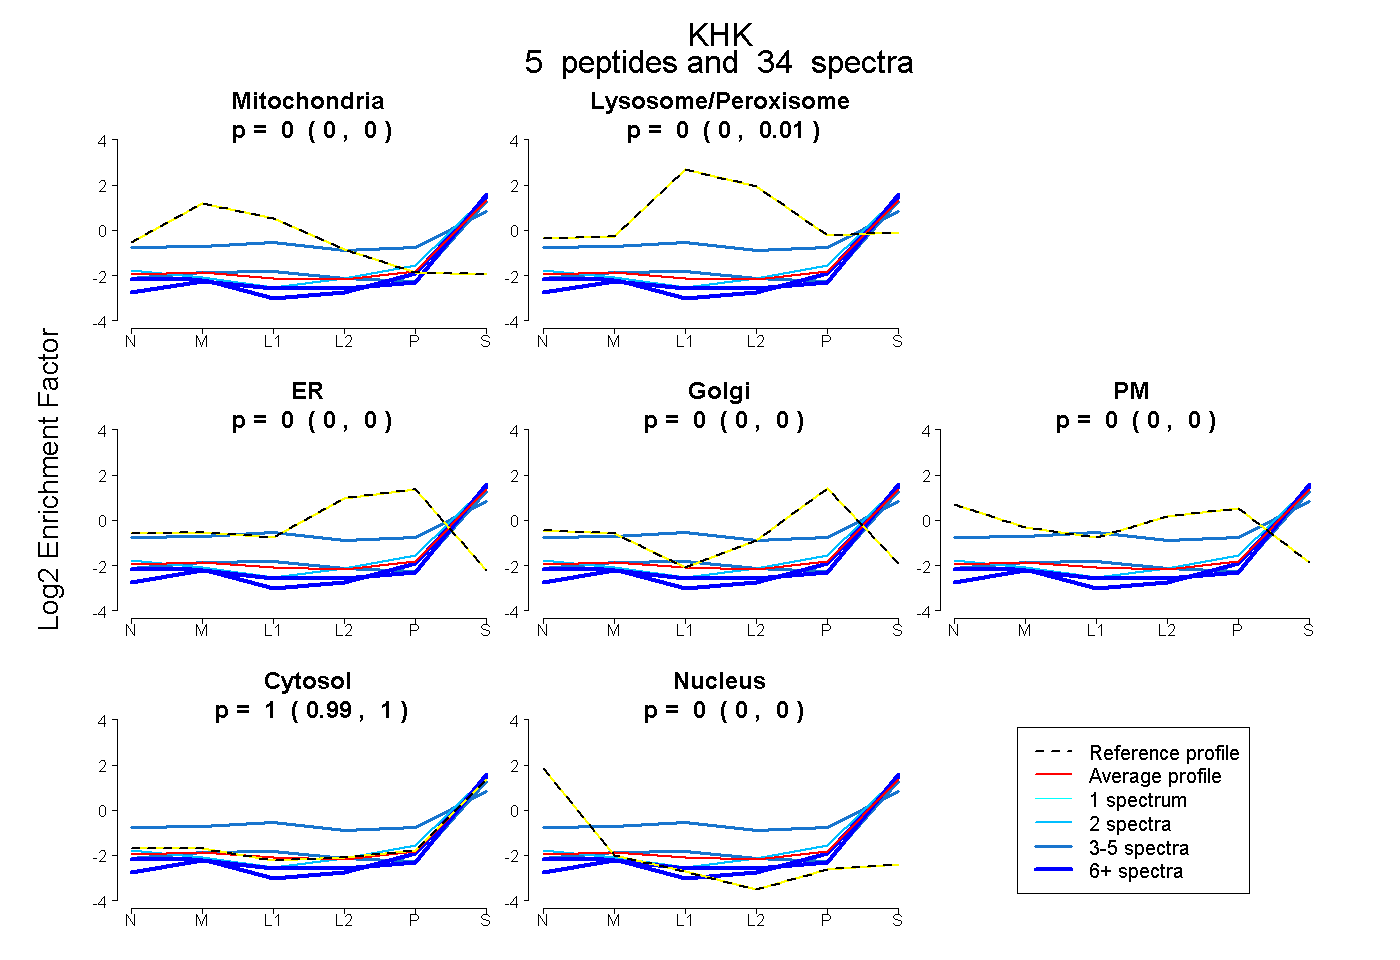 |
0.000 0.000 | 0.000 |
0.000 0.000 | 0.007 |
0.000 0.000 | 0.000 |
0.000 0.000 | 0.000 |
0.000 0.000 | 0.000 |
1.000 0.991 | 1.000 |
0.000 0.000 | 0.000 |
|||
| Plot | Lyso | Other | |||||||||||
| Expt C |
9 peptides |
163 spectra |
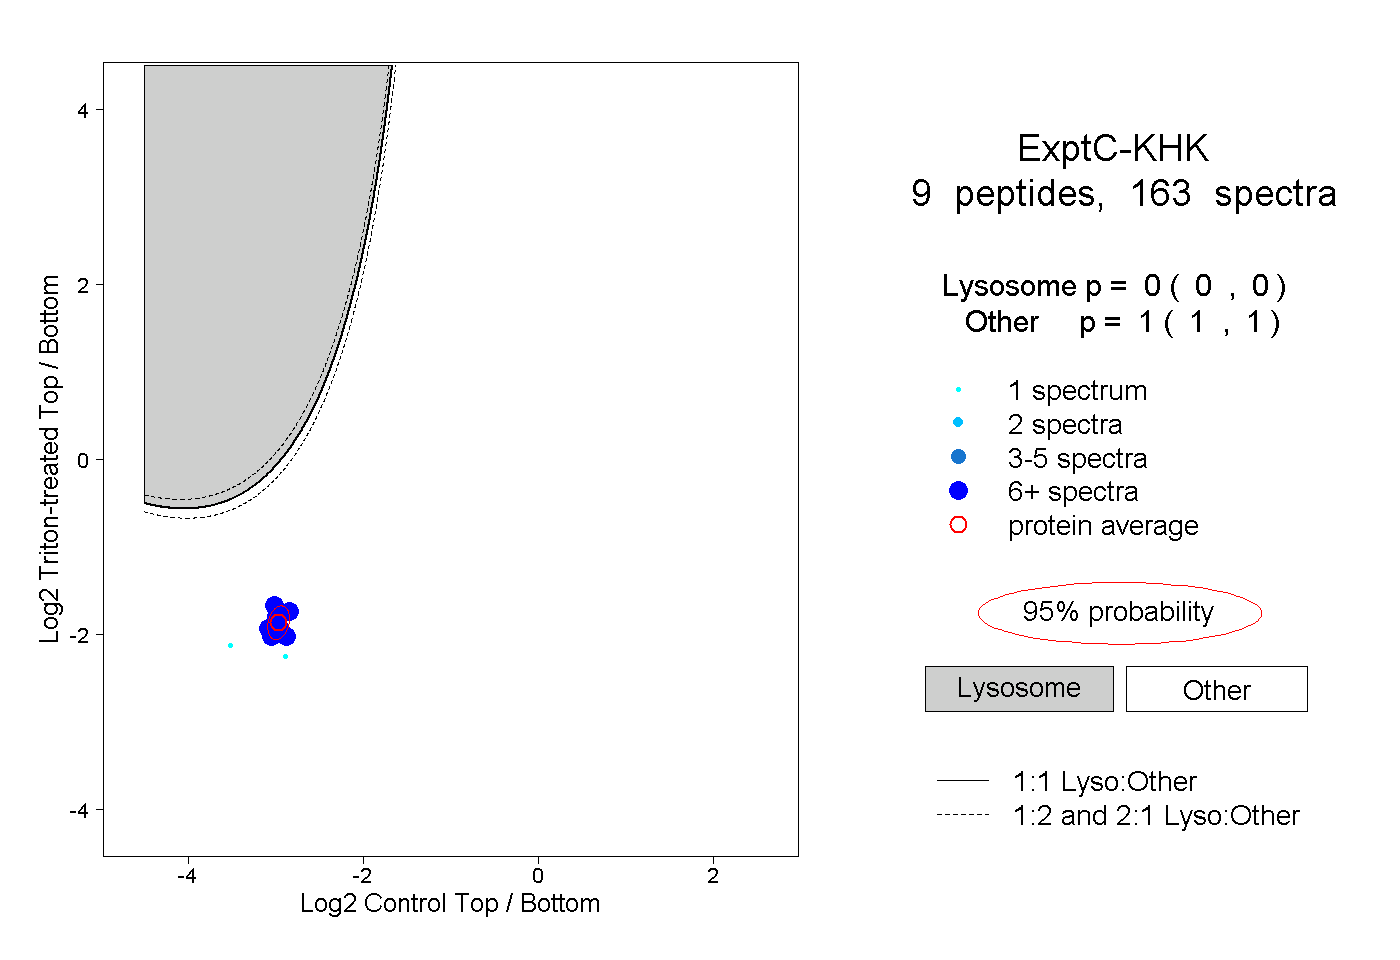 |
0.000 0.000 | 0.000 |
1.000 1.000 | 1.000 |
||||||||
| Plot | Lyso | Other | |||||||||||
| Expt D |
5 peptides |
13 spectra |
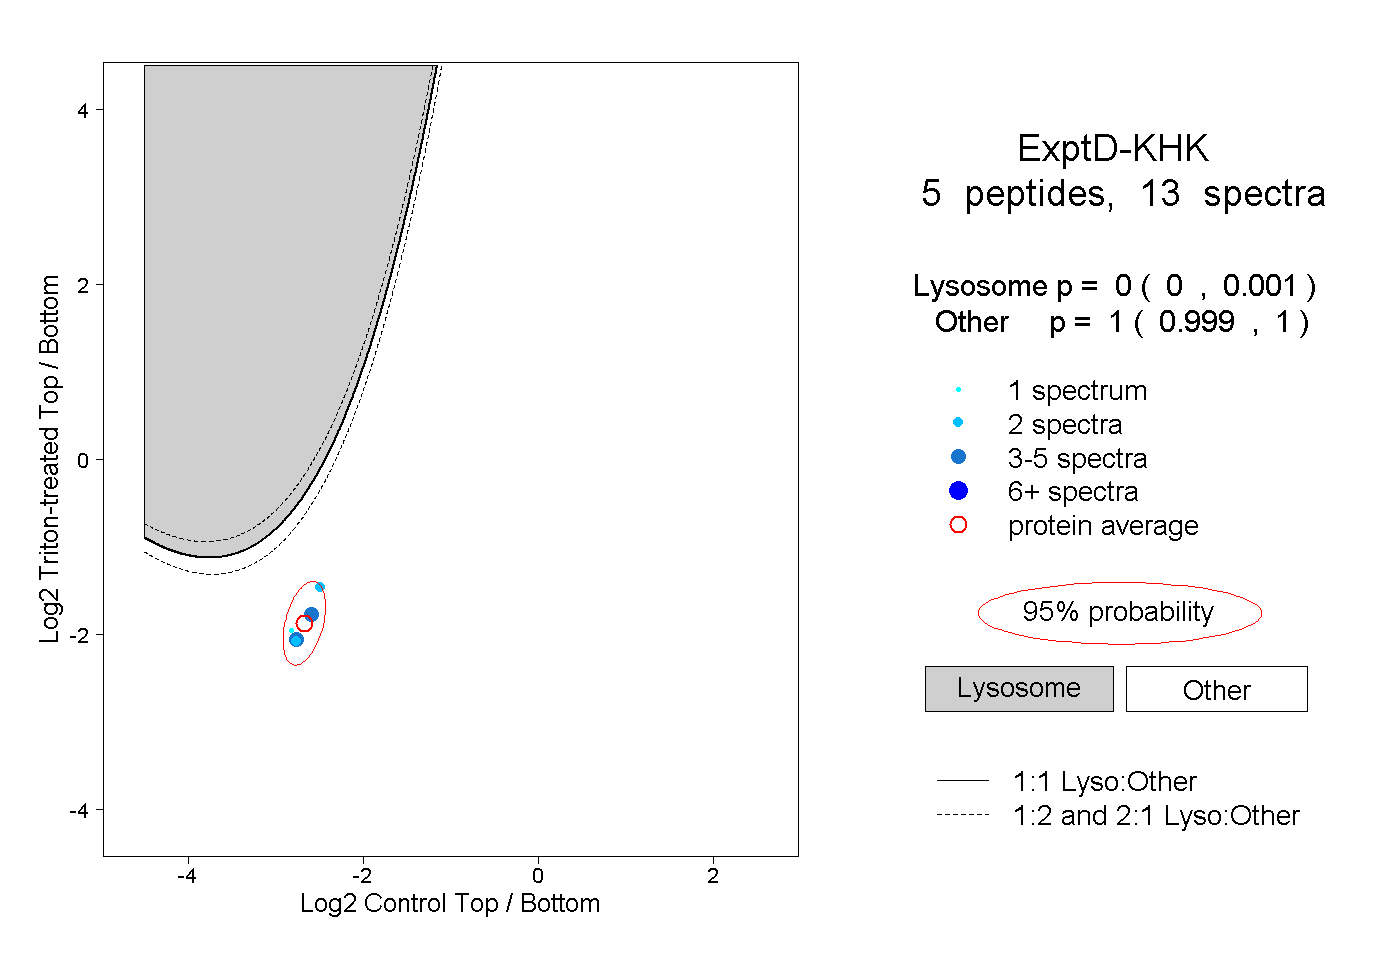 |
0.000 0.000 | 0.001 |
1.000 0.999 | 1.000 |