 41
41peptides
spectra
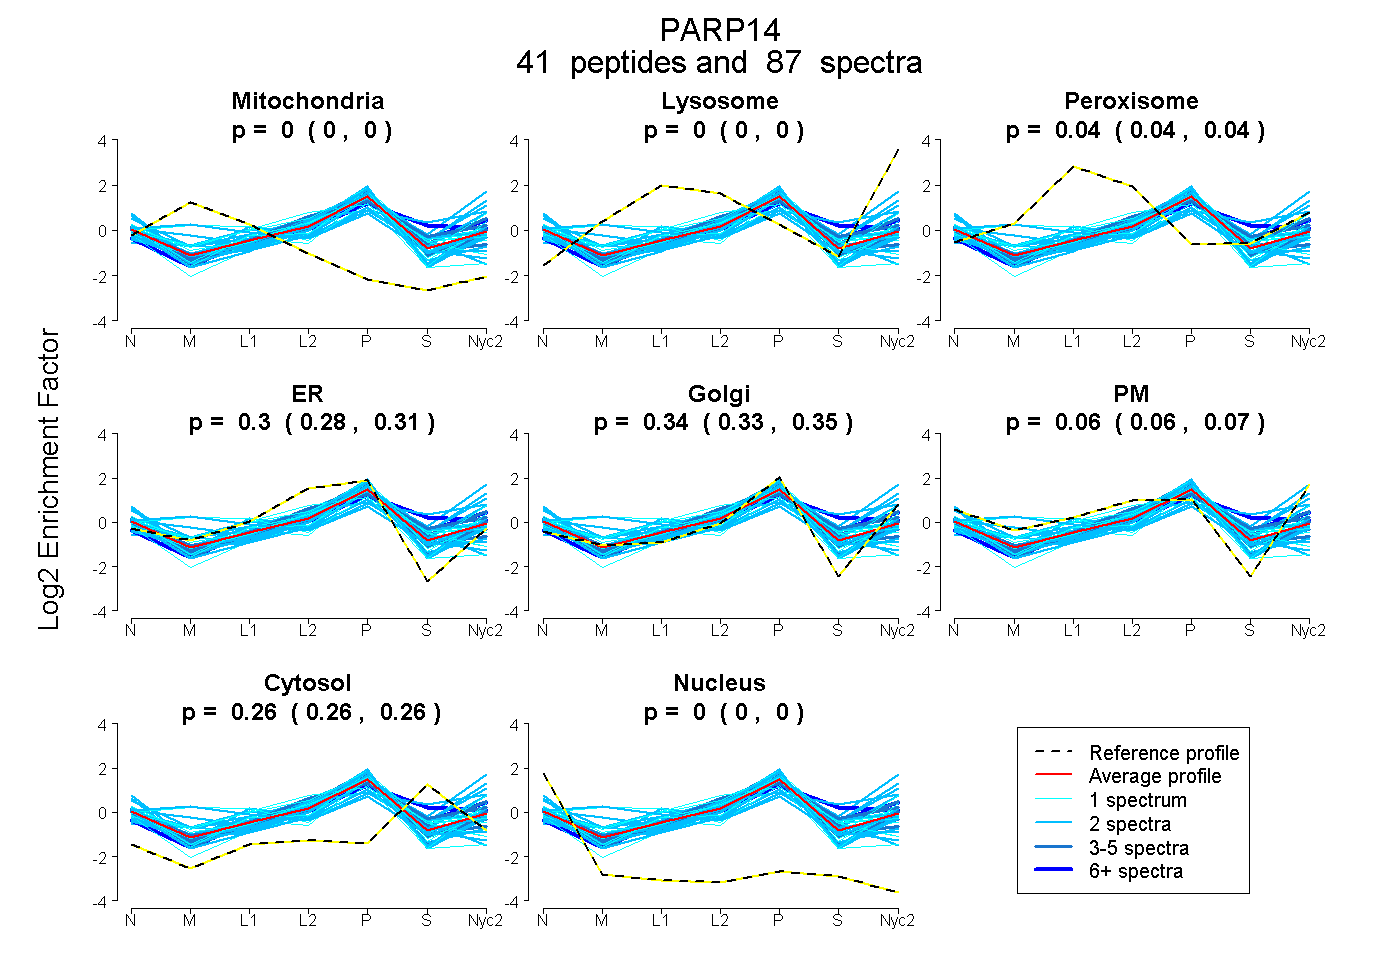
0.000 | 0.000
0.000 | 0.000
0.037 | 0.045
0.285 | 0.306
0.327 | 0.347
0.055 | 0.071
0.258 | 0.264
0.000 | 0.000
17peptides
spectra
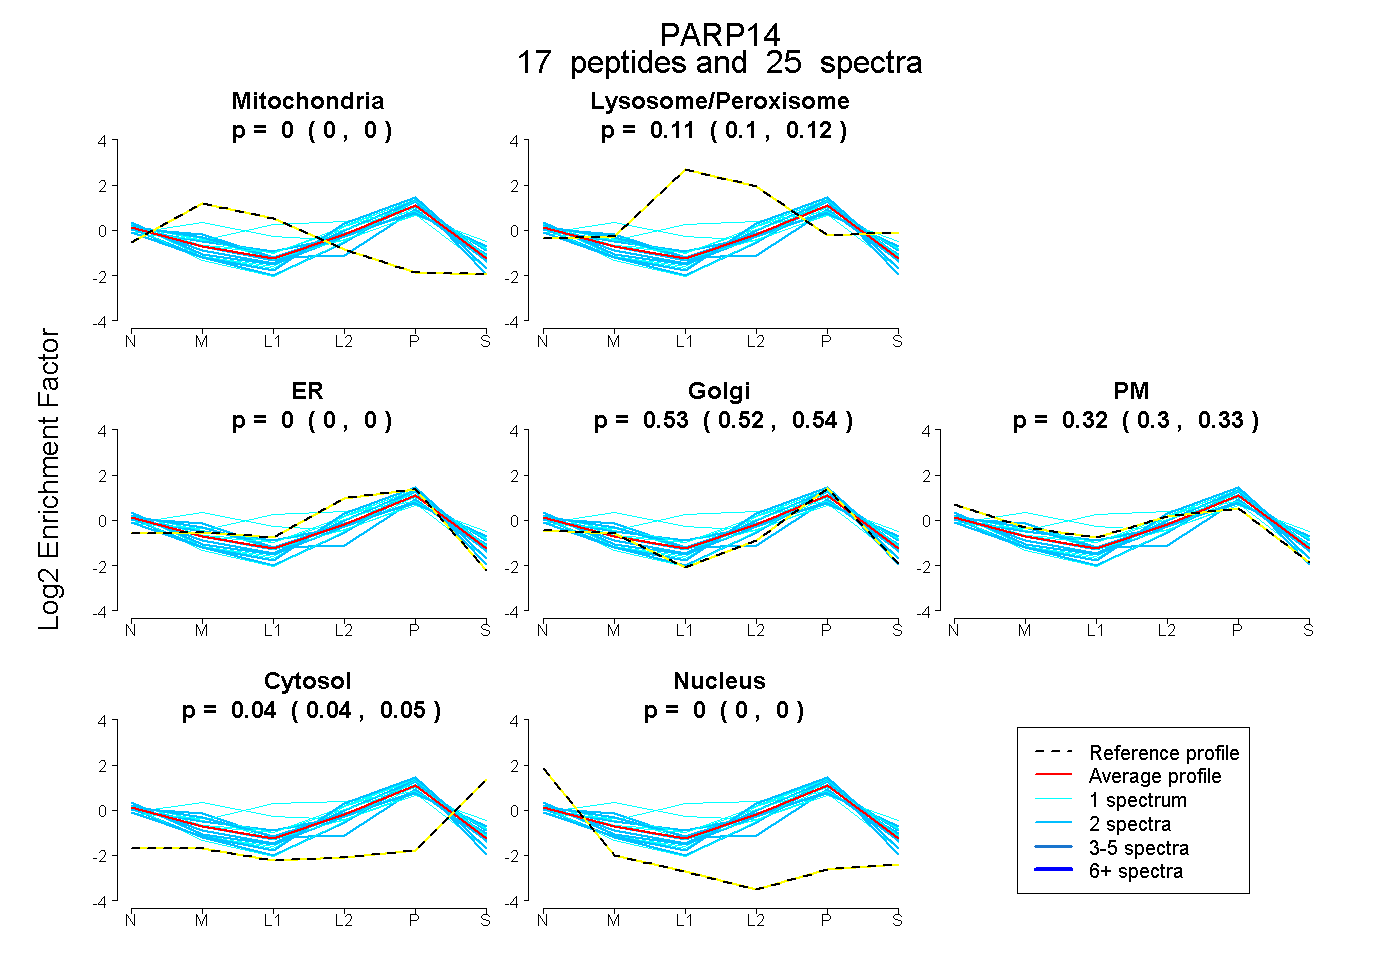
0.000 | 0.000
0.099 | 0.118
0.000 | 0.000
0.519 | 0.544
0.298 | 0.328
0.036 | 0.049
0.000 | 0.000
33peptides
spectra
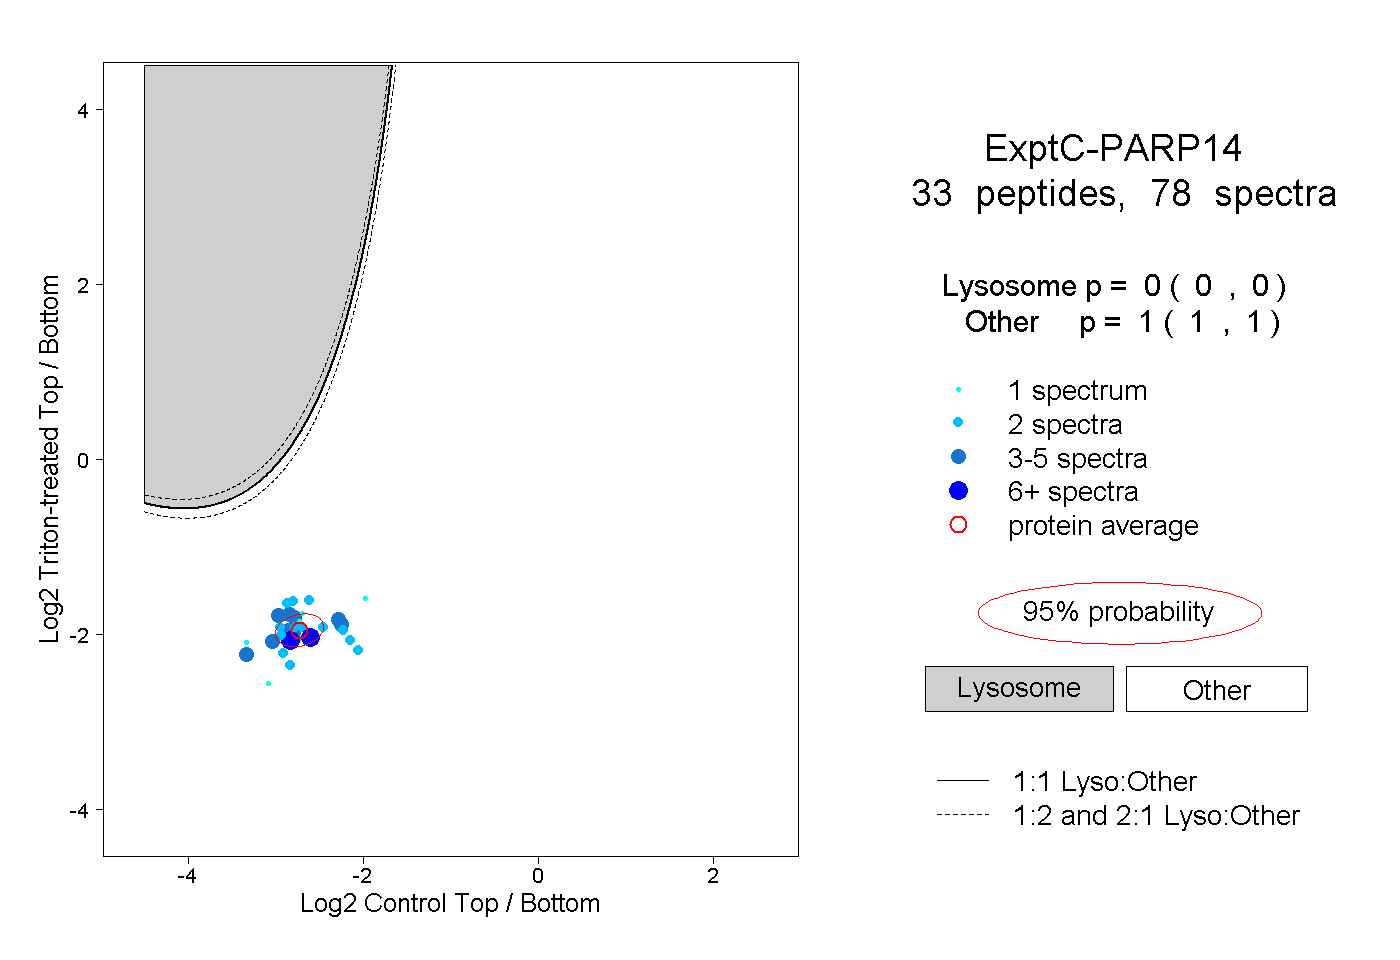
0.000 | 0.000
1.000 | 1.000
13peptides
spectra
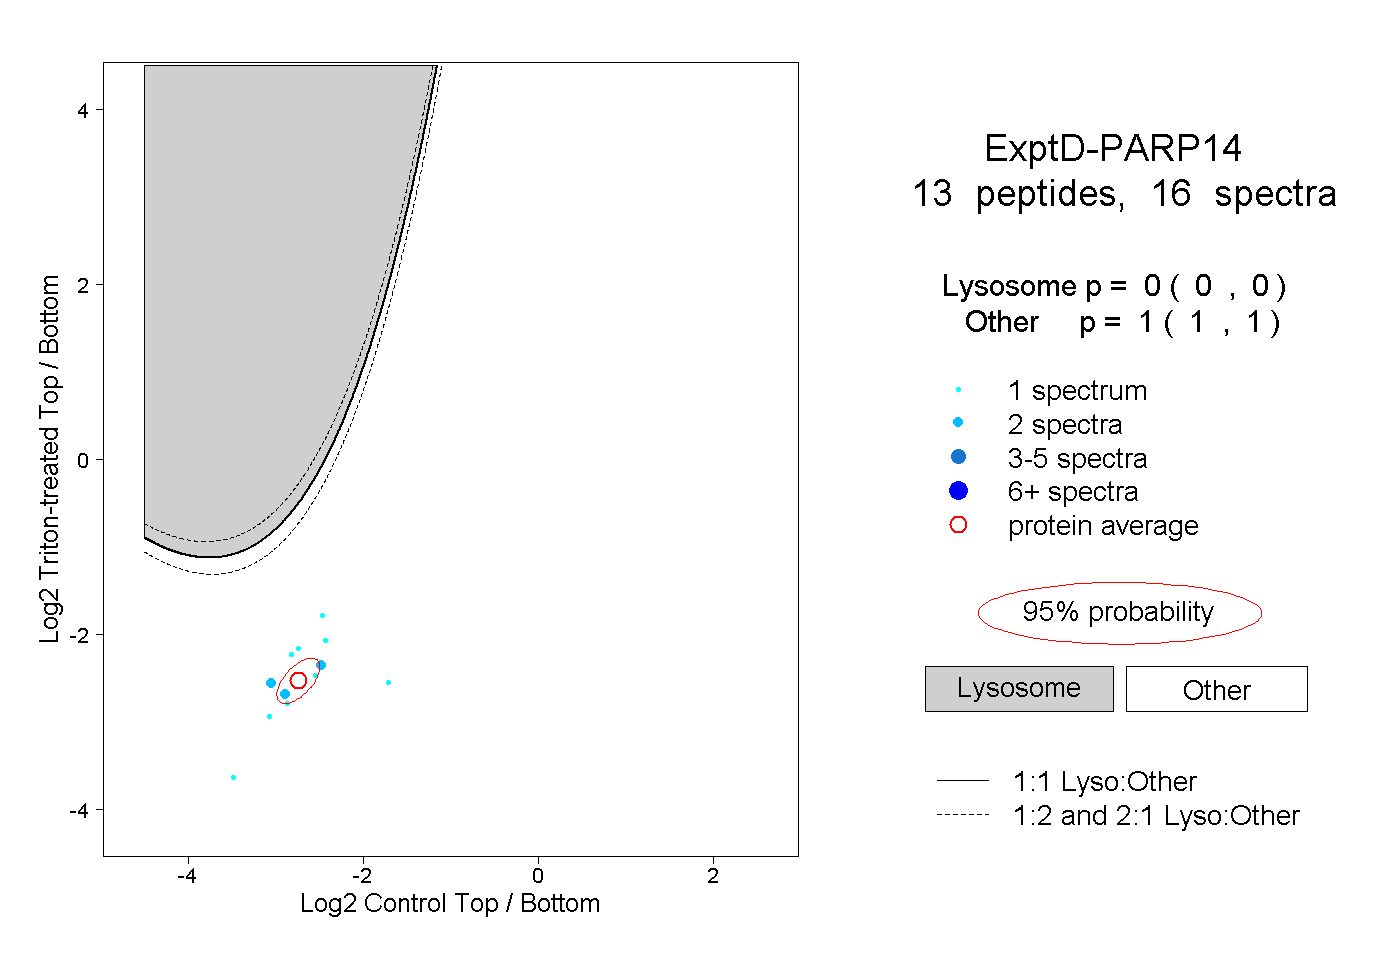
0.000 | 0.000
1.000 | 1.000