 1
1peptide
spectrum
NA | NA
NA | NA
NA | NA
NA | NA
NA | NA
NA | NA
NA | NA
| Plot | Mito | Lyso or Perox | ER | Golgi | PM | Cytosol | Nucleus | ||||||
| Expt B |
1 peptide |
1 spectrum |
|
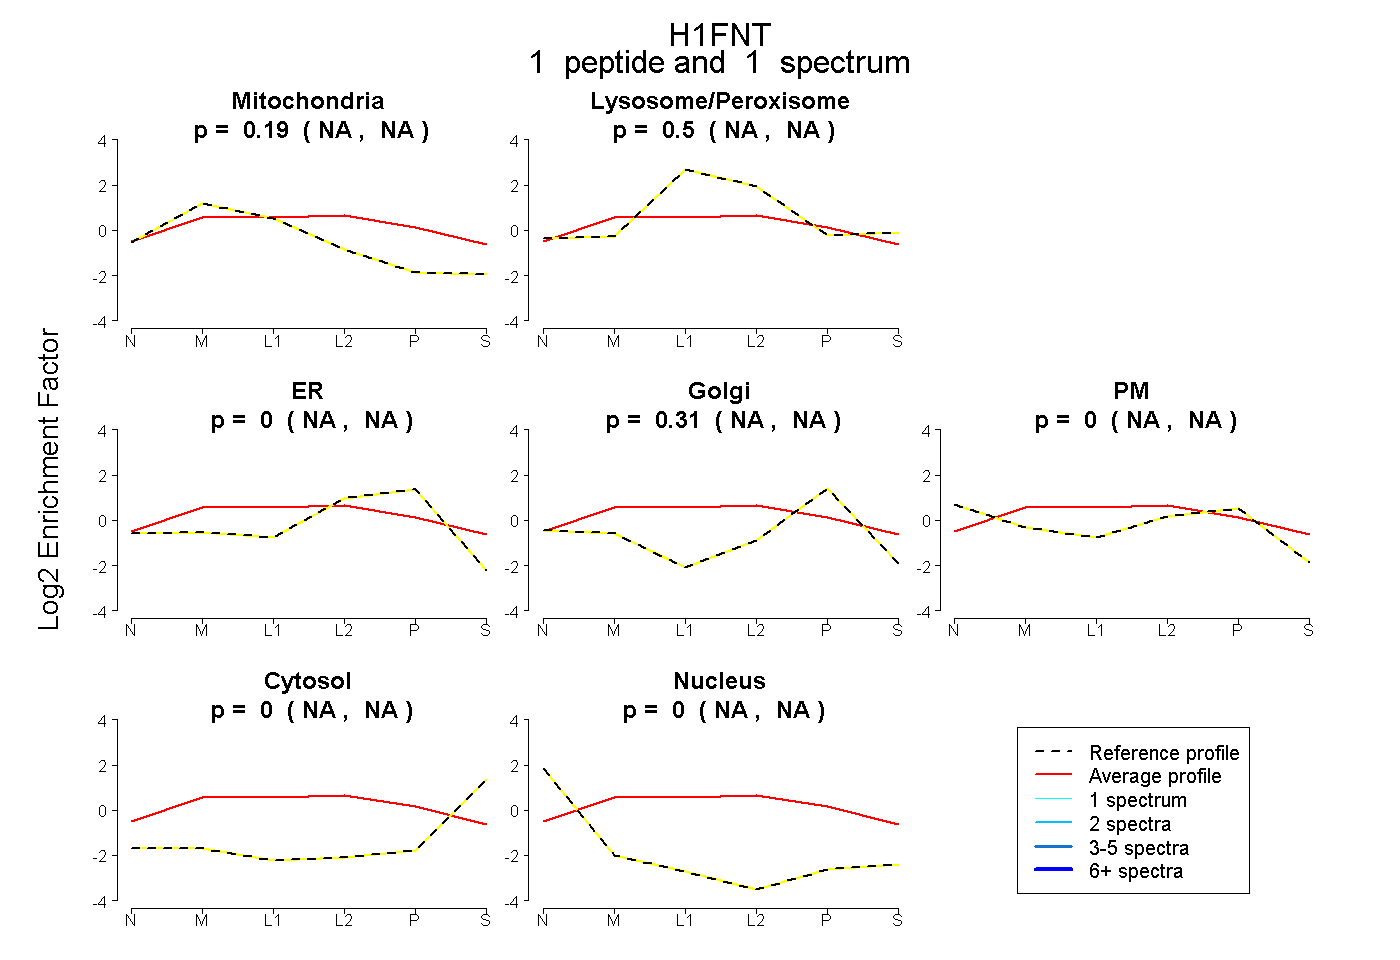
0.194 NA | NA |
0.495 NA | NA |
0.000 NA | NA |
0.309 NA | NA |
0.000 NA | NA |
0.003 NA | NA |
0.000 NA | NA |
| 1 spectrum, LTLGSHSHGK | 0.194 | 0.495 | 0.000 | 0.309 | 0.000 | 0.003 | 0.000 |