 6
6peptides
spectra
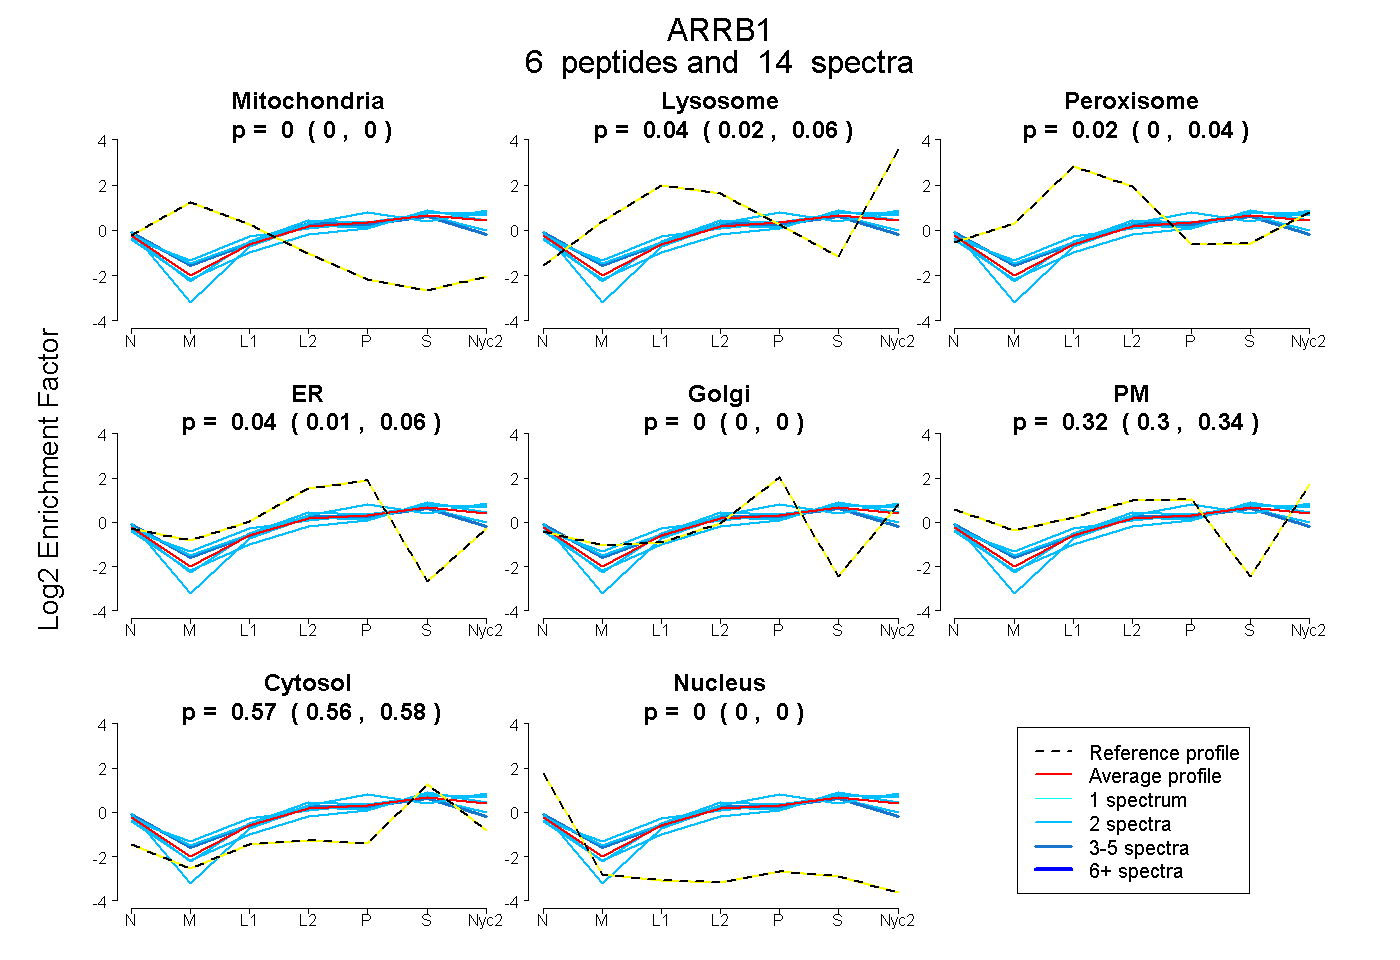
0.000 | 0.000
0.016 | 0.057
0.000 | 0.042
0.012 | 0.065
0.000 | 0.000
0.297 | 0.345
0.563 | 0.584
0.000 | 0.000
| Plot | Mito | Lyso | Perox | ER | Golgi | PM | Cytosol | Nucleus | |||||
| Expt A |
6 peptides |
14 spectra |
|
0.000 0.000 | 0.000 |
0.038 0.016 | 0.057 |
0.022 0.000 | 0.042 |
0.043 0.012 | 0.065 |
0.000 0.000 | 0.000 |
0.322 0.297 | 0.345 |
0.575 0.563 | 0.584 |
0.000 0.000 | 0.000 |
| 2 spectra, VQYAPERPGPQPTAETTR | 0.000 | 0.000 | 0.000 | 0.000 | 0.000 | 0.352 | 0.648 | 0.000 | ||
| 2 spectra, ACGVDYEVK | 0.000 | 0.000 | 0.217 | 0.054 | 0.159 | 0.072 | 0.498 | 0.000 | ||
| 2 spectra, LTVYLGK | 0.000 | 0.119 | 0.000 | 0.000 | 0.114 | 0.319 | 0.449 | 0.000 | ||
| 2 spectra, EDLDVLGLTFR | 0.000 | 0.039 | 0.000 | 0.000 | 0.022 | 0.278 | 0.661 | 0.000 | ||
| 4 spectra, AFCAENLEEK | 0.000 | 0.000 | 0.100 | 0.179 | 0.000 | 0.169 | 0.552 | 0.000 | ||
| 2 spectra, EEPPHR | 0.000 | 0.108 | 0.000 | 0.026 | 0.000 | 0.308 | 0.558 | 0.000 |
| Plot | Lyso | Other | |||||||||||
| Expt C |
7 peptides |
24 spectra |
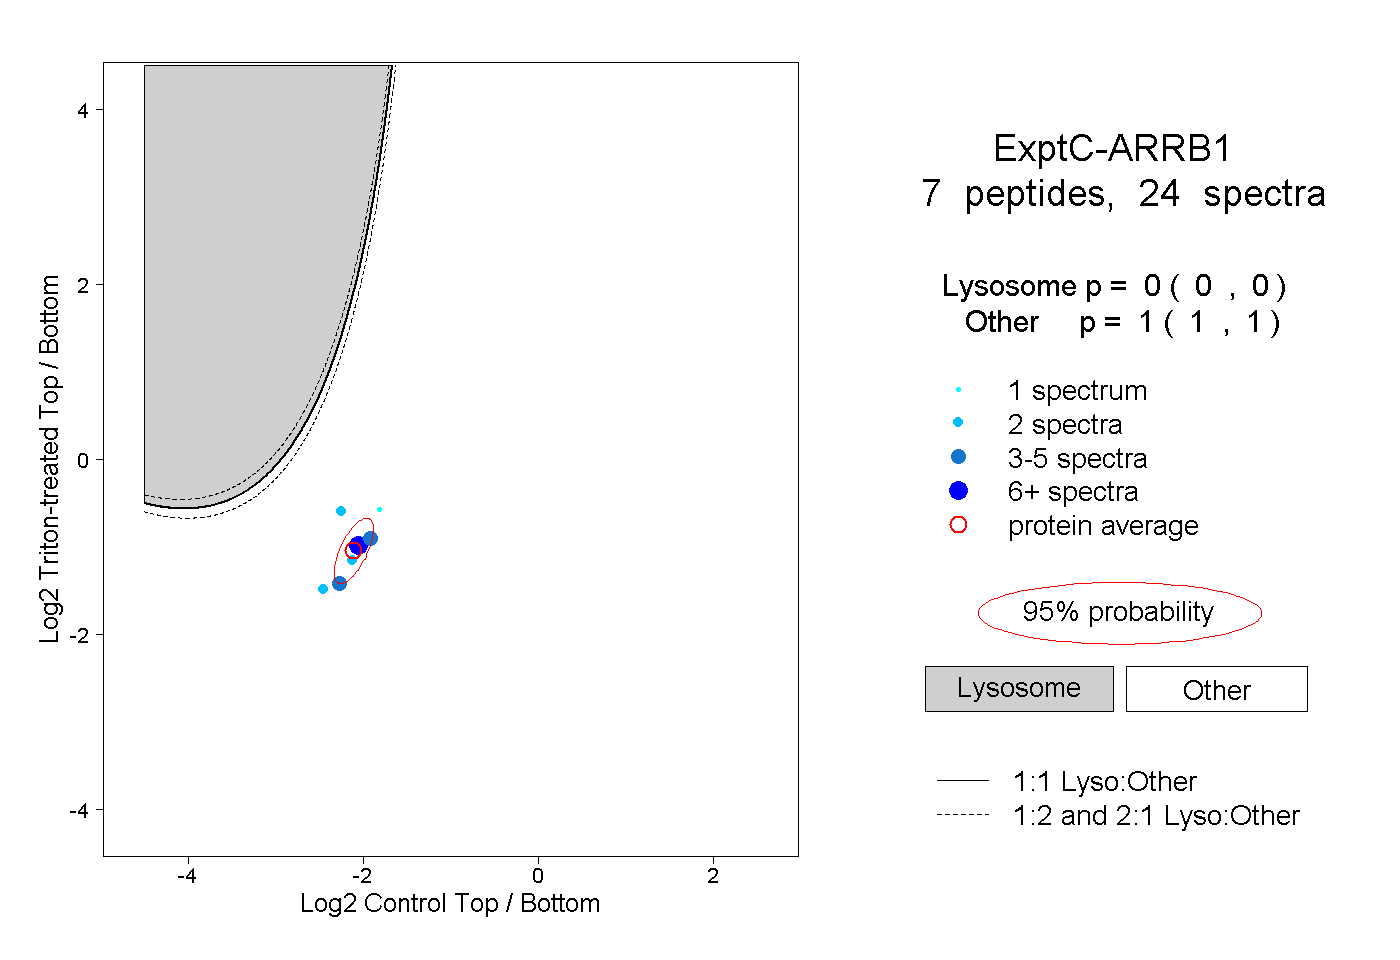 |
0.000 0.000 | 0.000 |
1.000 1.000 | 1.000 |
||||||||
| Plot | Lyso | Other | |||||||||||
| Expt D |
1 peptide |
2 spectra |
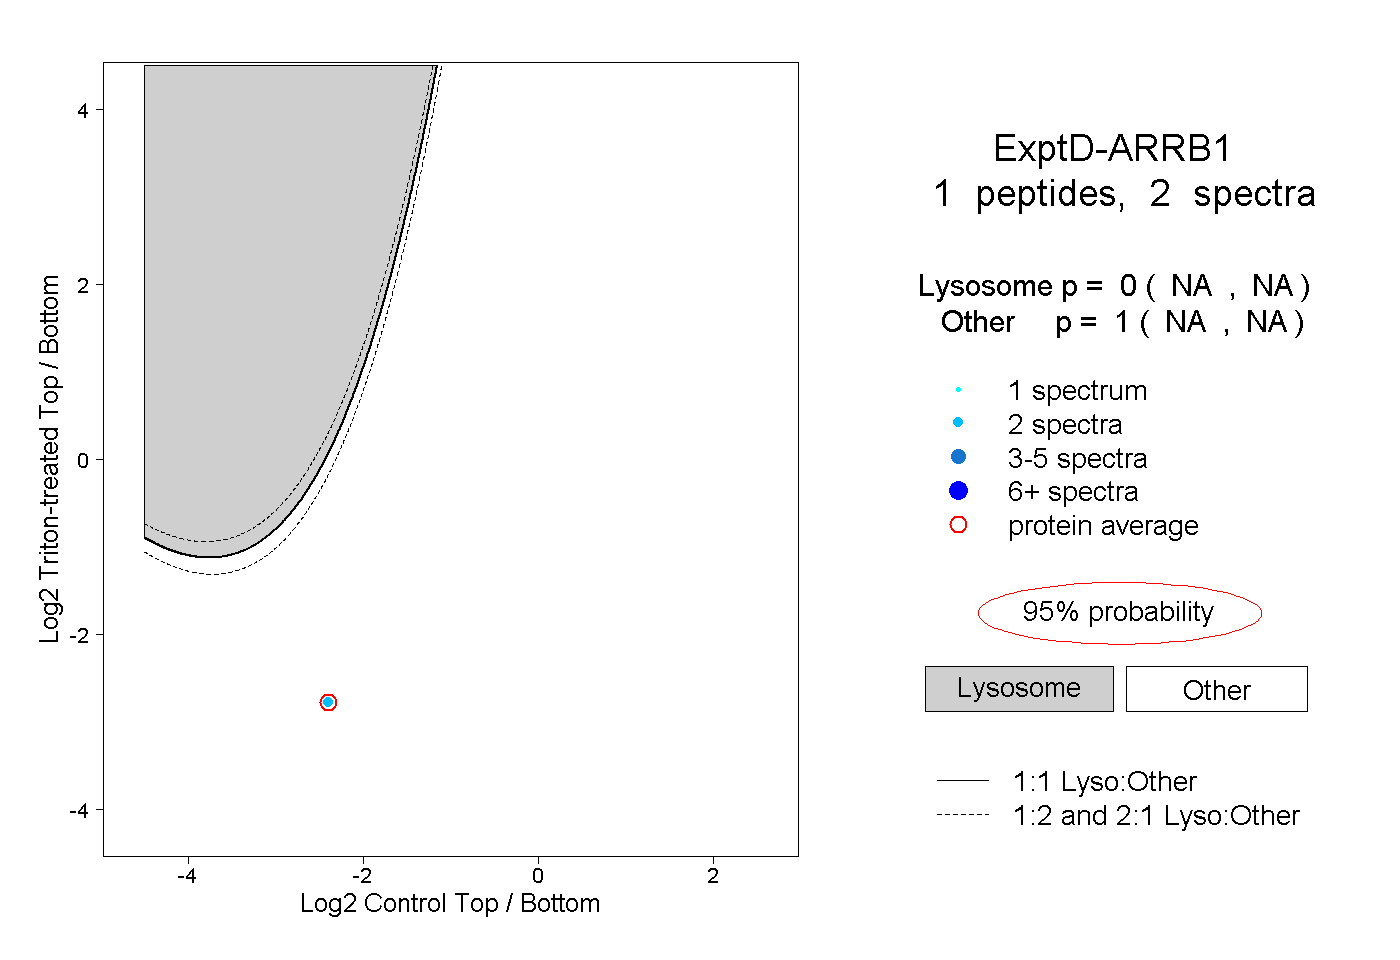 |
0.000 NA | NA |
1.000 NA | NA |