 7
7peptides
spectra
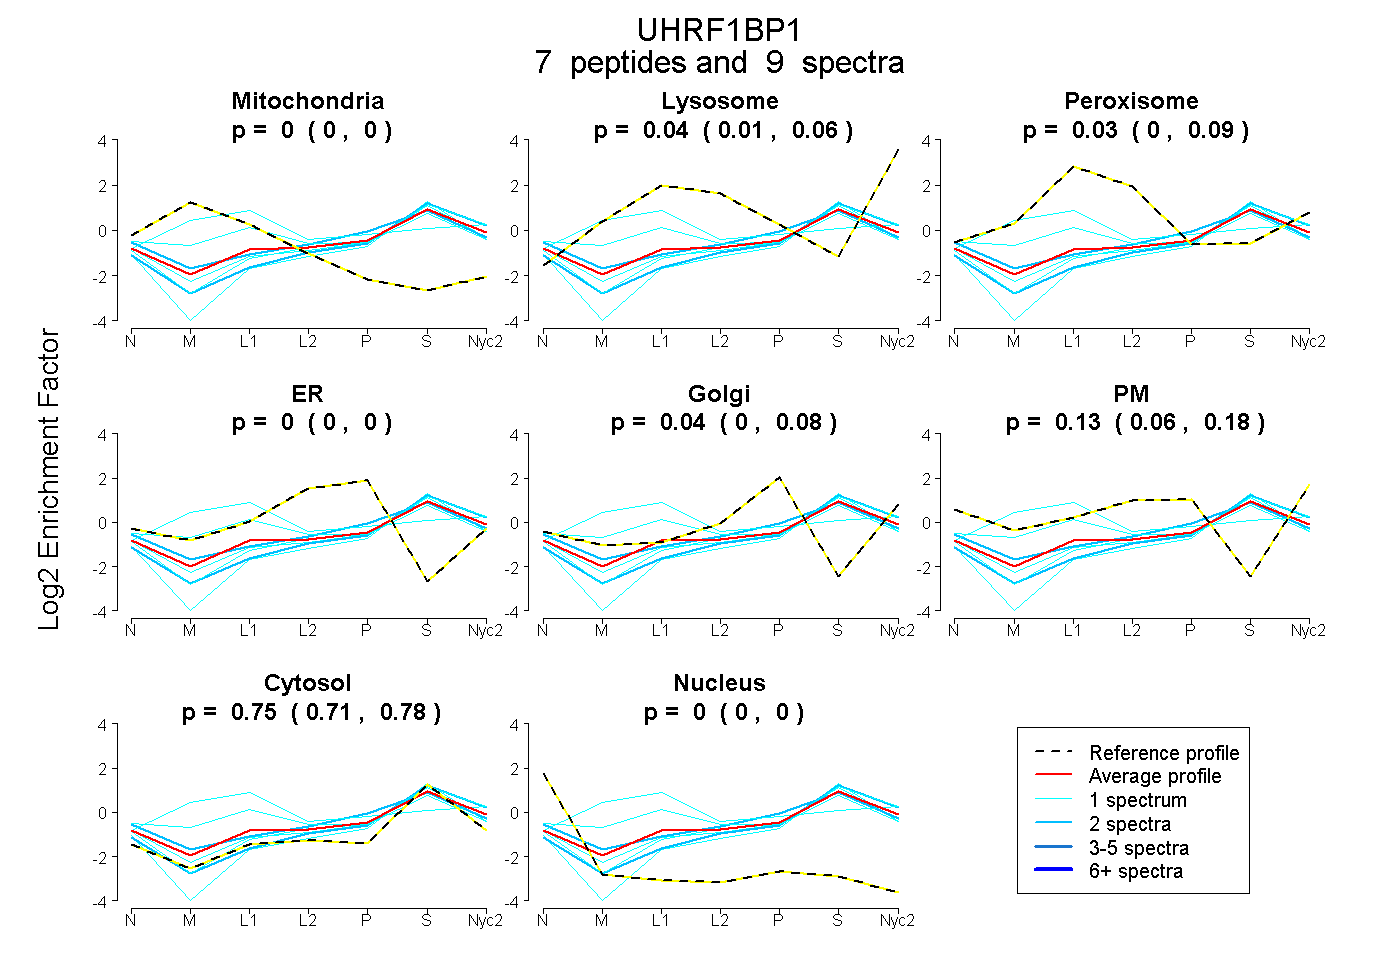
0.000 | 0.000
0.014 | 0.064
0.000 | 0.088
0.000 | 0.000
0.000 | 0.082
0.060 | 0.175
0.714 | 0.779
0.000 | 0.000
4peptides
spectra
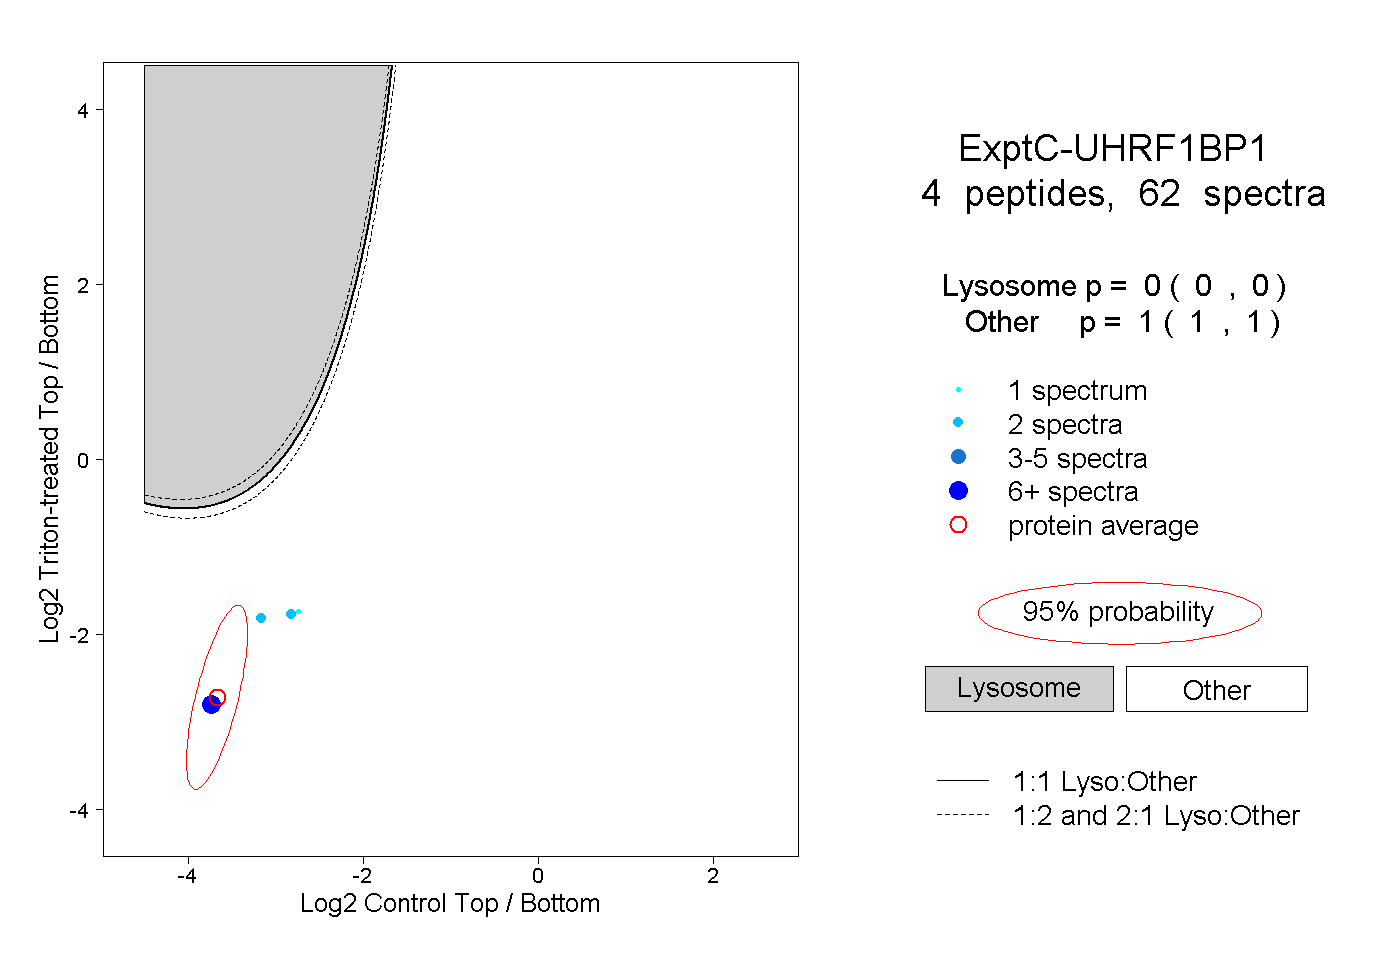
0.000 | 0.000
1.000 | 1.000
2peptides
spectra
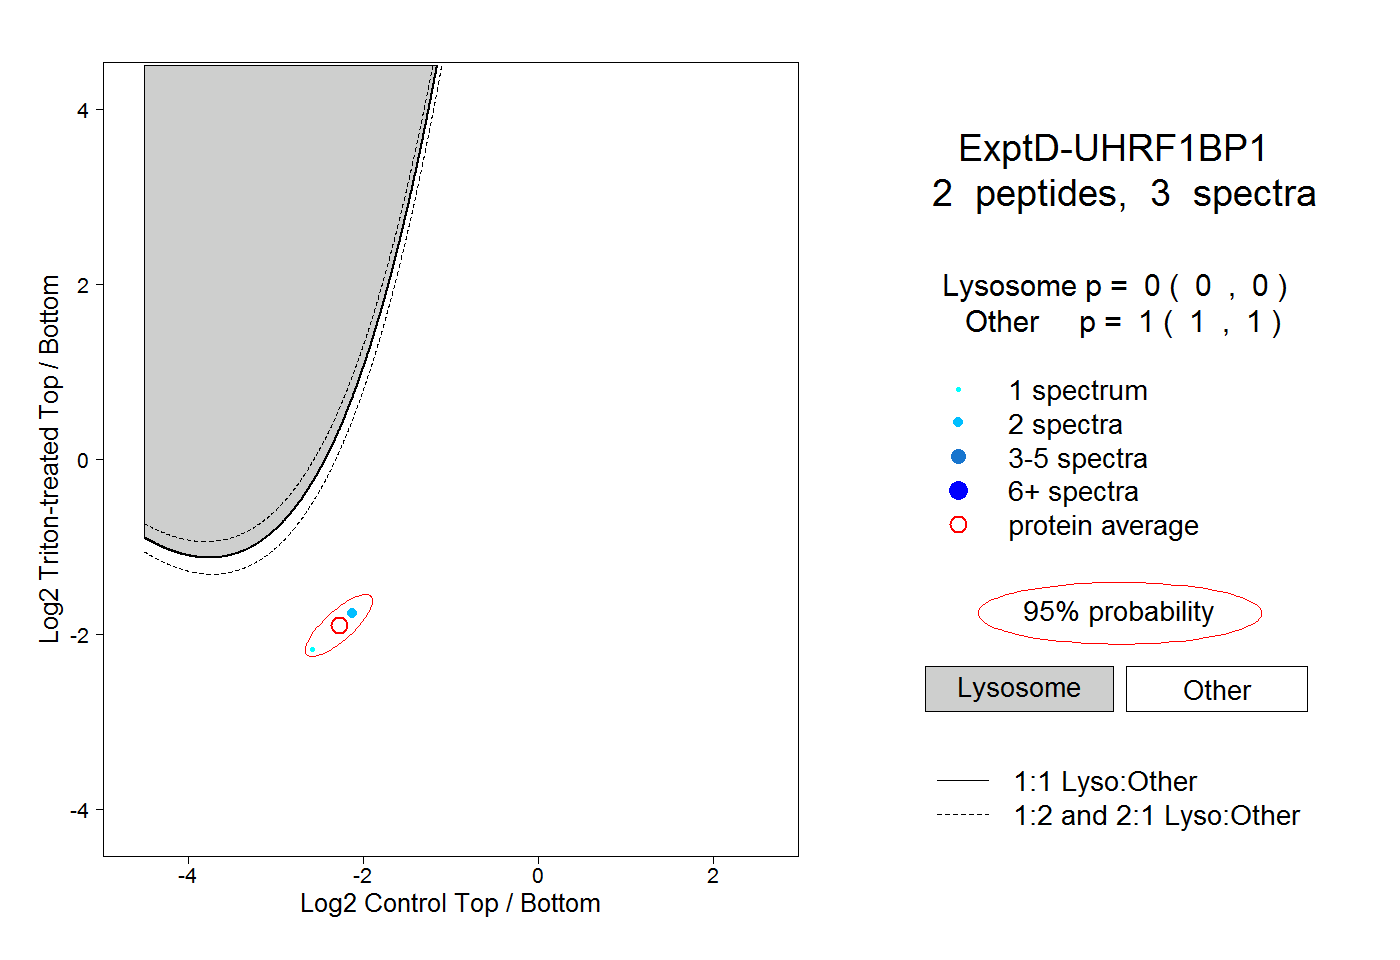
0.000 | 0.000
1.000 | 1.000