 7
7peptides
spectra
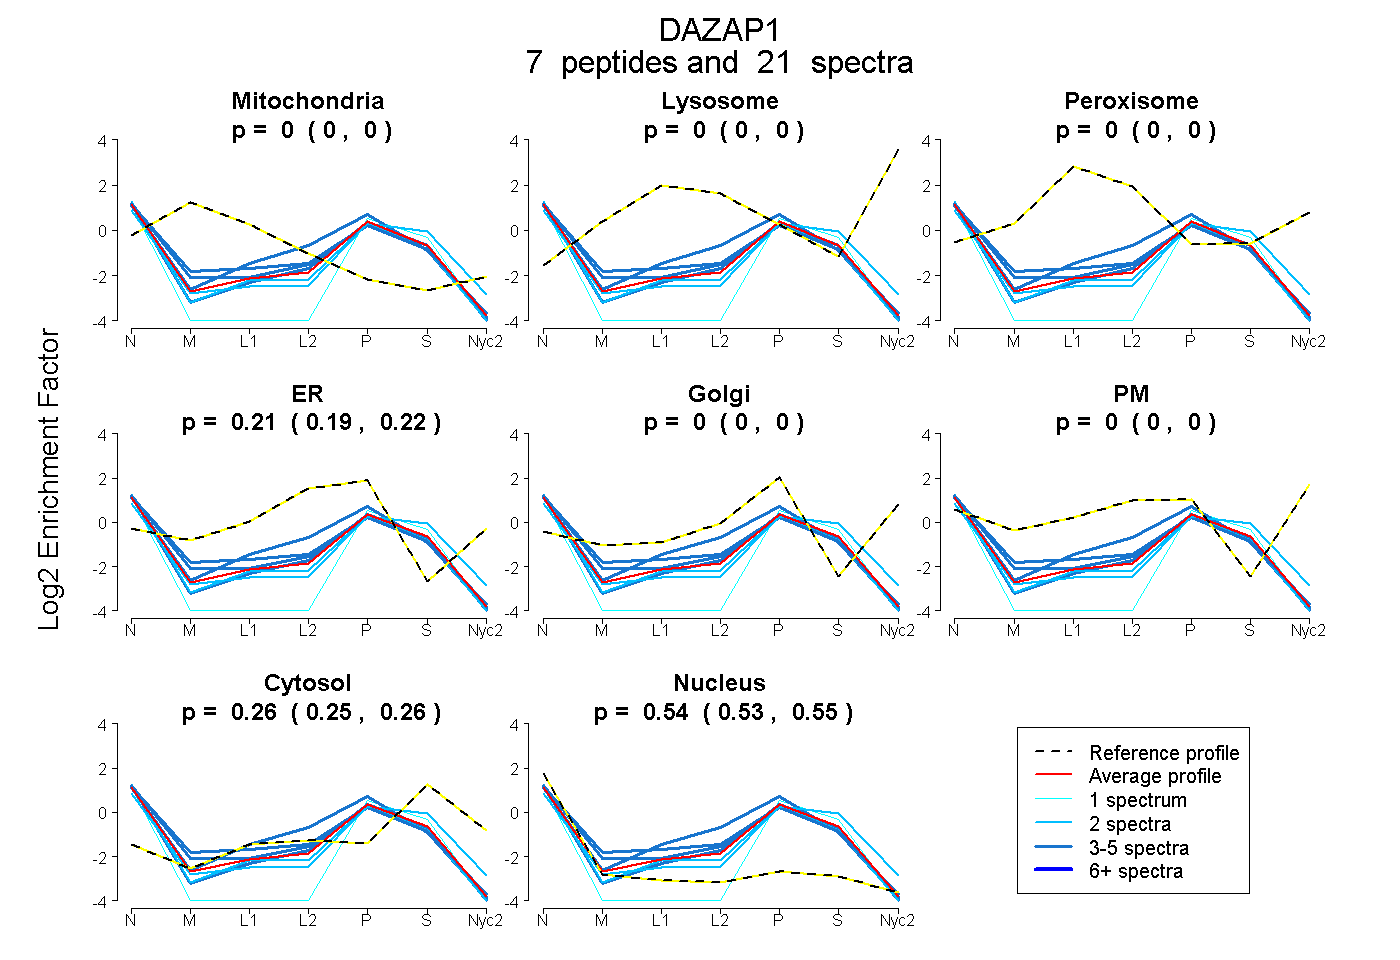
0.000 | 0.000
0.000 | 0.000
0.000 | 0.000
0.192 | 0.217
0.000 | 0.000
0.000 | 0.000
0.246 | 0.265
0.527 | 0.547
| Plot | Mito | Lyso | Perox | ER | Golgi | PM | Cytosol | Nucleus | |||||
| Expt A |
7 peptides |
21 spectra |
|
0.000 0.000 | 0.000 |
0.000 0.000 | 0.000 |
0.000 0.000 | 0.000 |
0.206 0.192 | 0.217 |
0.000 0.000 | 0.000 |
0.000 0.000 | 0.000 |
0.256 0.246 | 0.265 |
0.538 0.527 | 0.547 |
| 4 spectra, IFVGGIPHNCGETELR | 0.000 | 0.000 | 0.000 | 0.184 | 0.000 | 0.000 | 0.250 | 0.566 | ||
| 1 spectrum, FGVVTEVVMIYDAEK | 0.000 | 0.000 | 0.000 | 0.000 | 0.000 | 0.000 | 0.284 | 0.716 | ||
| 2 spectra, SYFSQYGEVVDCVIMK | 0.000 | 0.000 | 0.000 | 0.000 | 0.134 | 0.000 | 0.415 | 0.451 | ||
| 4 spectra, GFGFVK | 0.000 | 0.000 | 0.000 | 0.300 | 0.000 | 0.000 | 0.186 | 0.514 | ||
| 4 spectra, GMQPER | 0.000 | 0.000 | 0.000 | 0.373 | 0.000 | 0.000 | 0.169 | 0.458 | ||
| 4 spectra, NIDPKPCTPR | 0.000 | 0.000 | 0.000 | 0.265 | 0.000 | 0.000 | 0.202 | 0.533 | ||
| 2 spectra, LFVGGLDWSTTQETLR | 0.000 | 0.000 | 0.000 | 0.164 | 0.000 | 0.000 | 0.230 | 0.606 |
| Plot | Mito | Lyso or Perox | ER | Golgi | PM | Cytosol | Nucleus | ||||||
| Expt B |
1 peptide |
2 spectra |
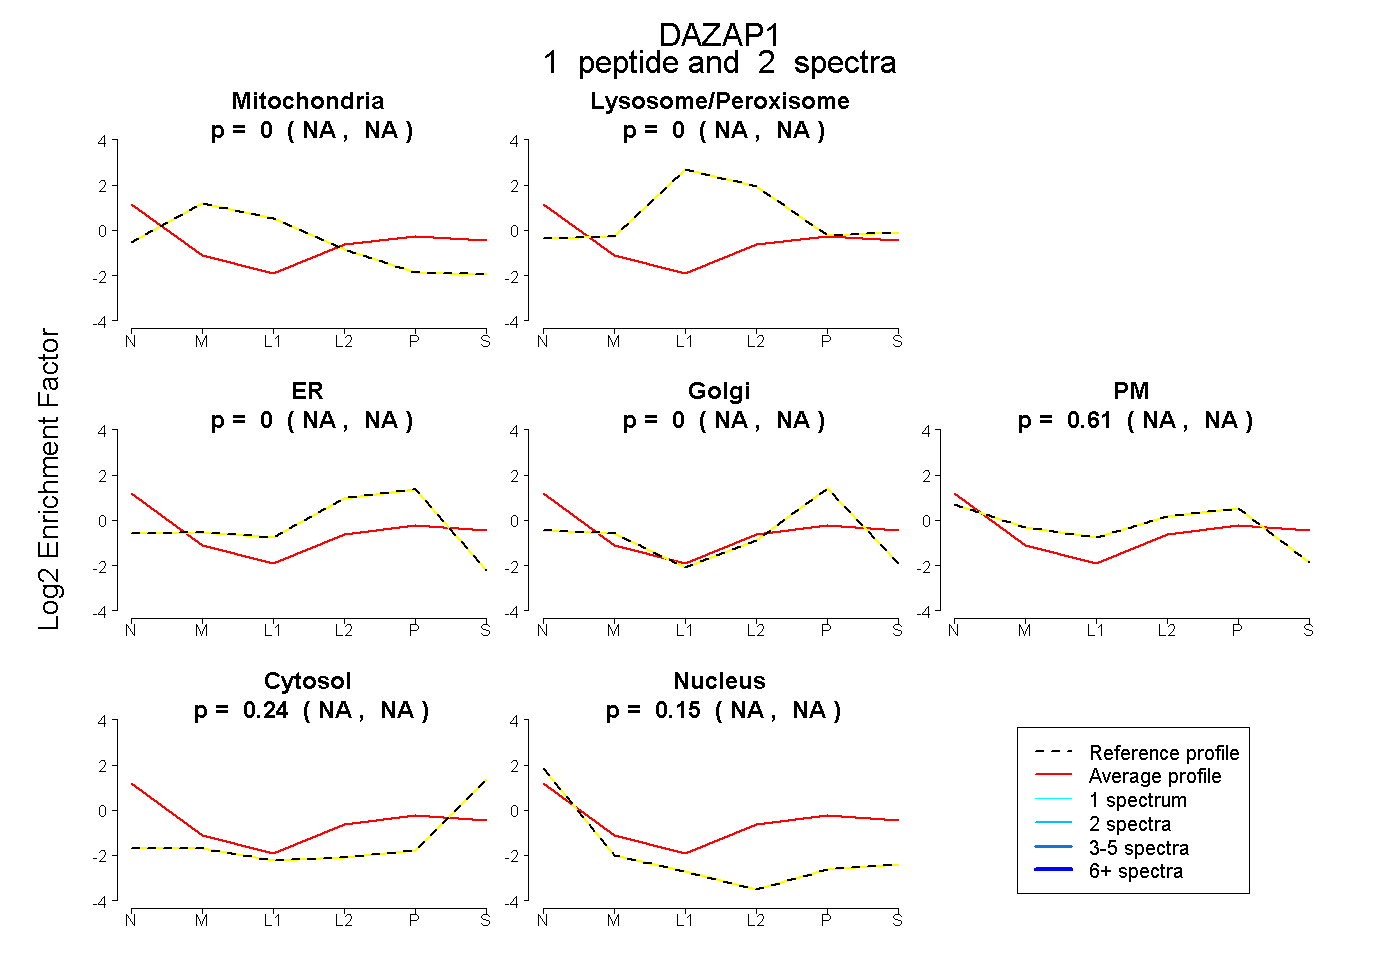 |
0.000 NA | NA |
0.000 NA | NA |
0.000 NA | NA |
0.000 NA | NA |
0.611 NA | NA |
0.240 NA | NA |
0.150 NA | NA |
|||
| Plot | Lyso | Other | |||||||||||
| Expt C |
3 peptides |
8 spectra |
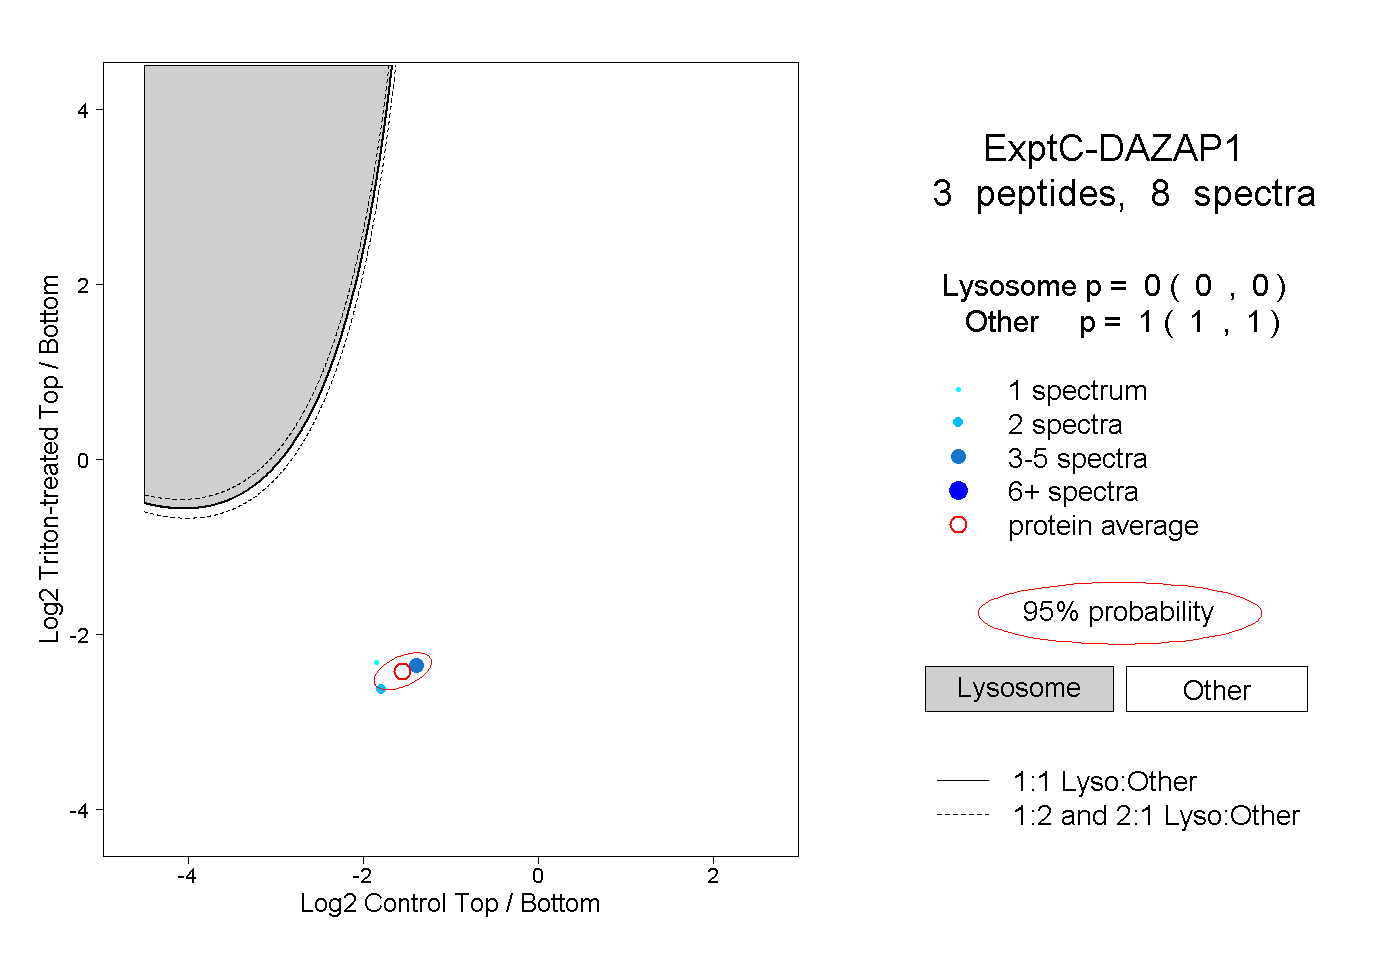 |
0.000 0.000 | 0.000 |
1.000 1.000 | 1.000 |
||||||||
| Plot | Lyso | Other | |||||||||||
| Expt D |
1 peptide |
1 spectrum |
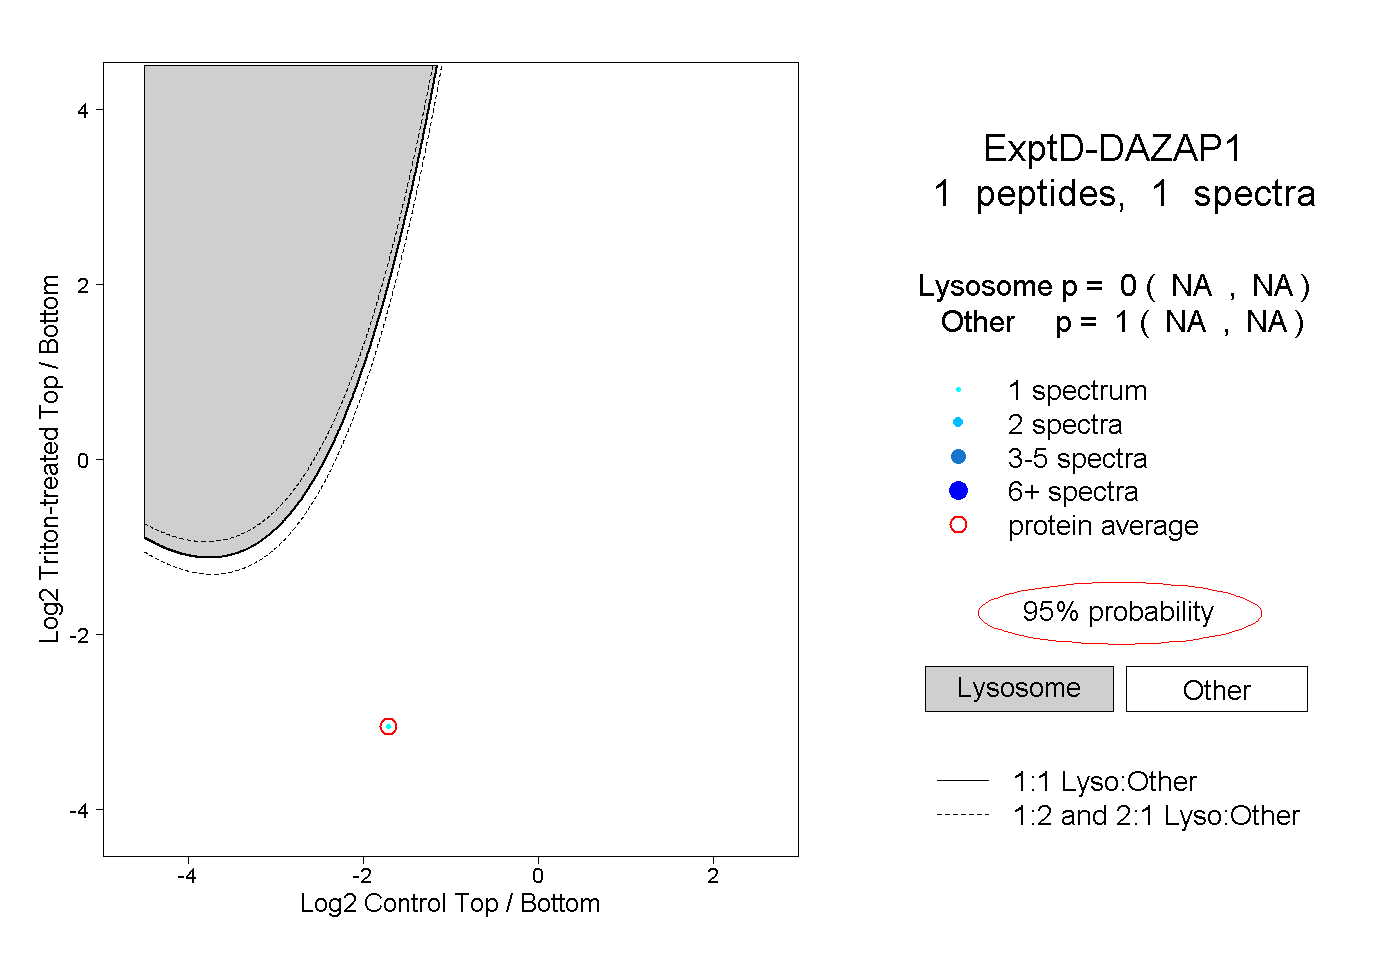 |
0.000 NA | NA |
1.000 NA | NA |