22
22peptides
spectra
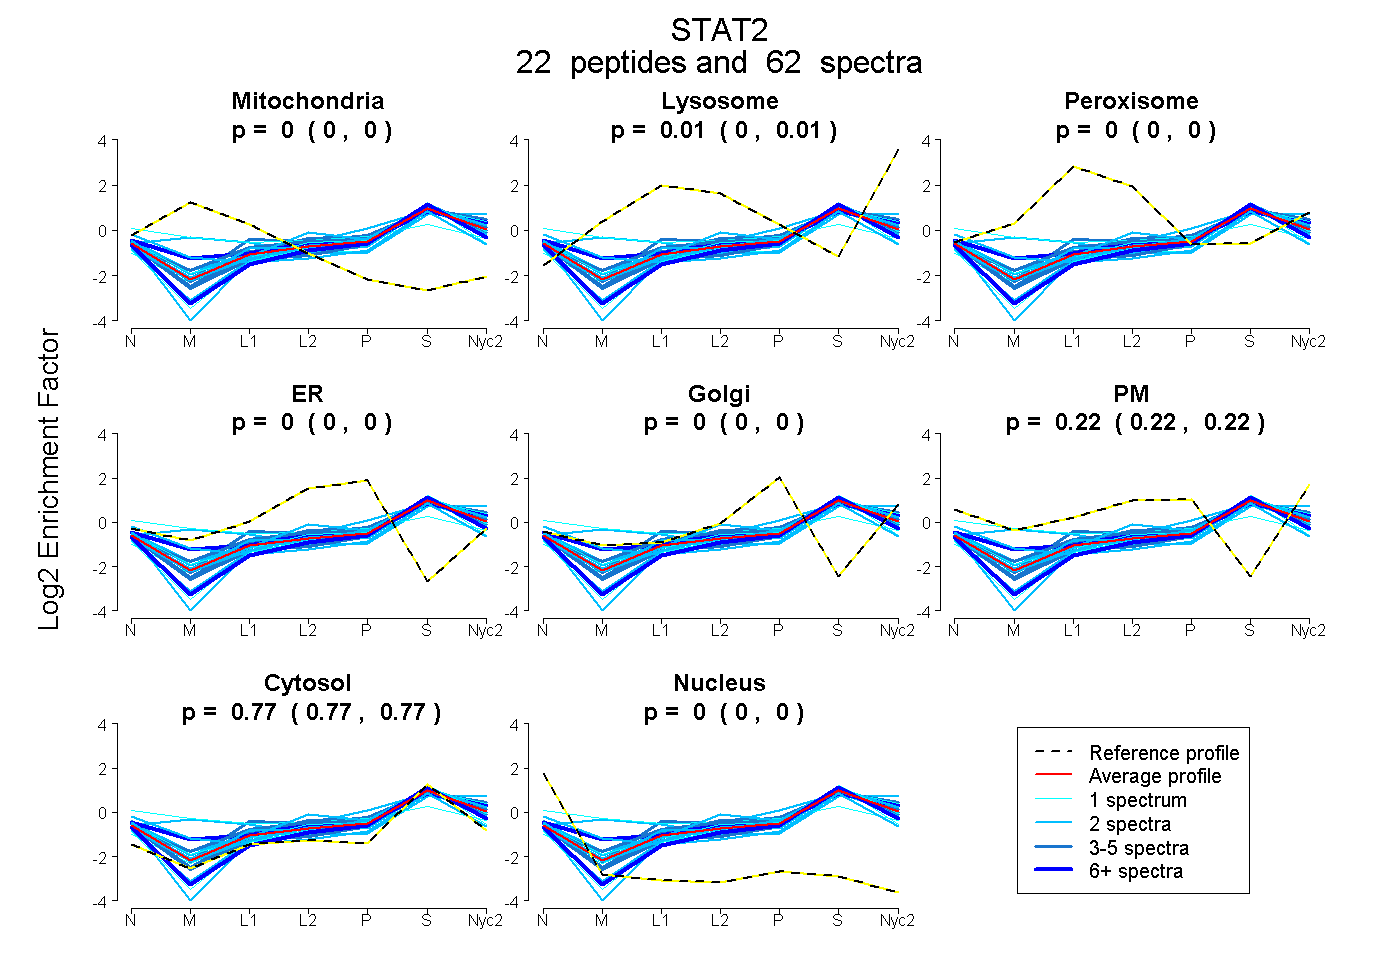
0.000 | 0.000
0.005 | 0.013
0.000 | 0.000
0.000 | 0.000
0.000 | 0.000
0.217 | 0.222
0.768 | 0.774
0.000 | 0.000
9peptides
spectra
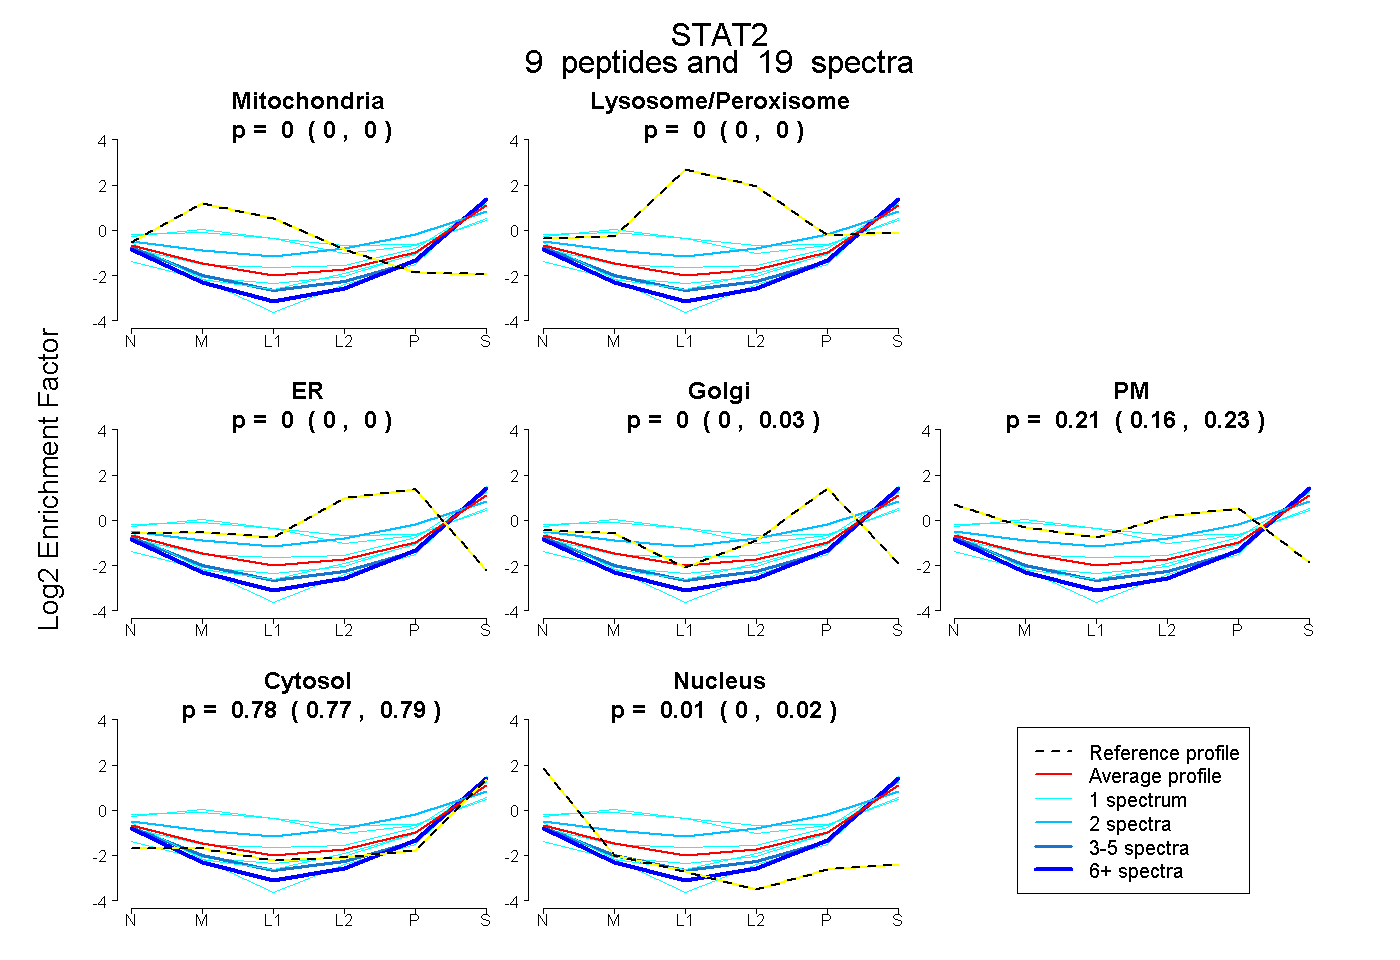
0.000 | 0.000
0.000 | 0.000
0.000 | 0.000
0.000 | 0.031
0.162 | 0.228
0.766 | 0.789
0.000 | 0.023