 1
1peptide
spectra
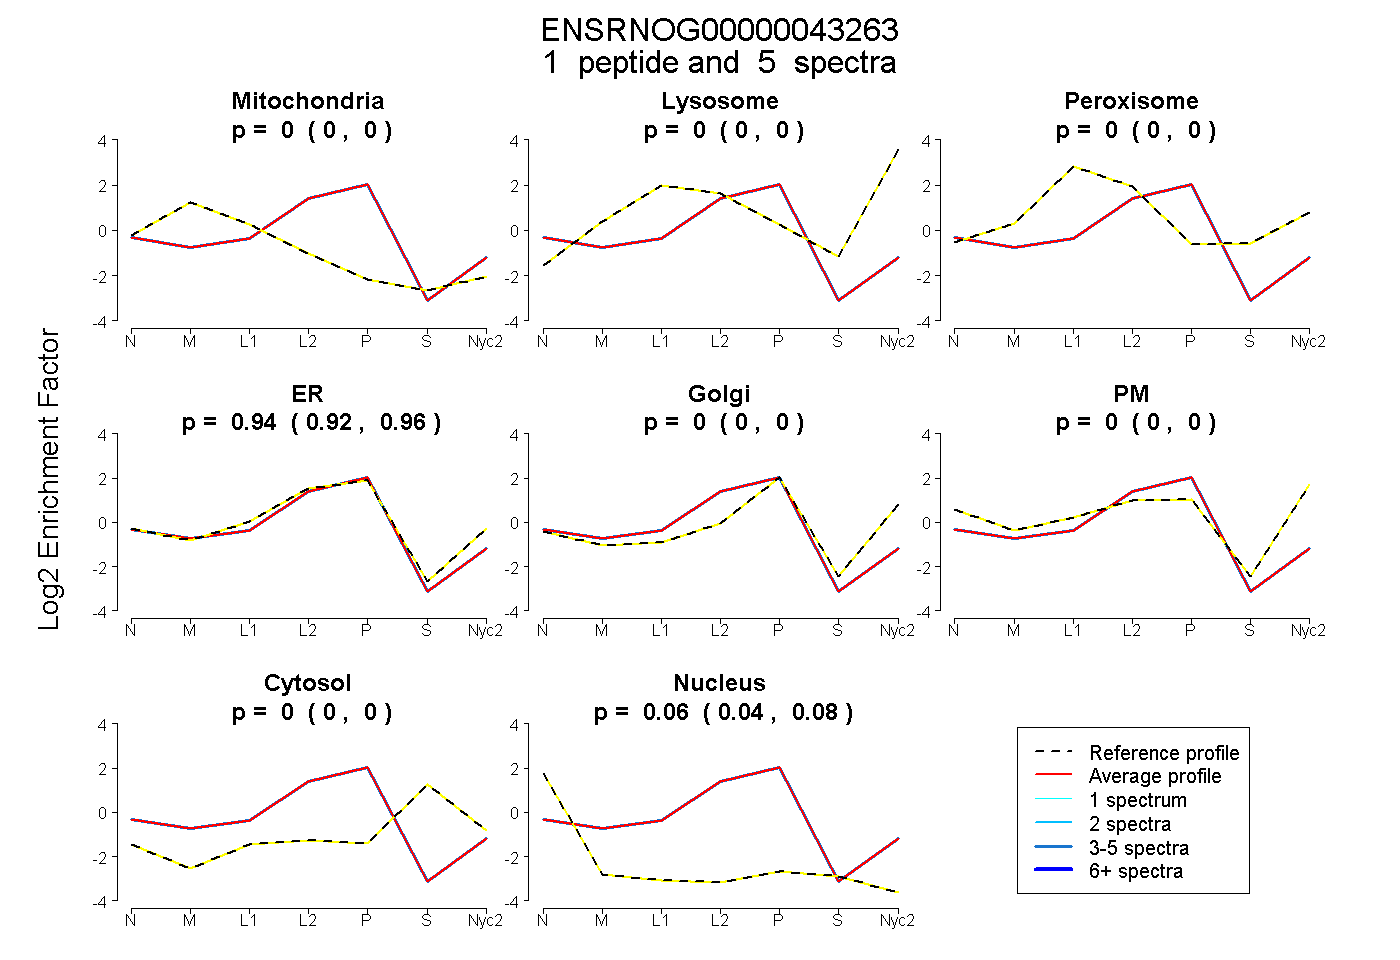
0.000 | 0.000
0.000 | 0.000
0.000 | 0.000
0.917 | 0.957
0.000 | 0.000
0.000 | 0.000
0.000 | 0.000
0.039 | 0.078
2peptides
spectra
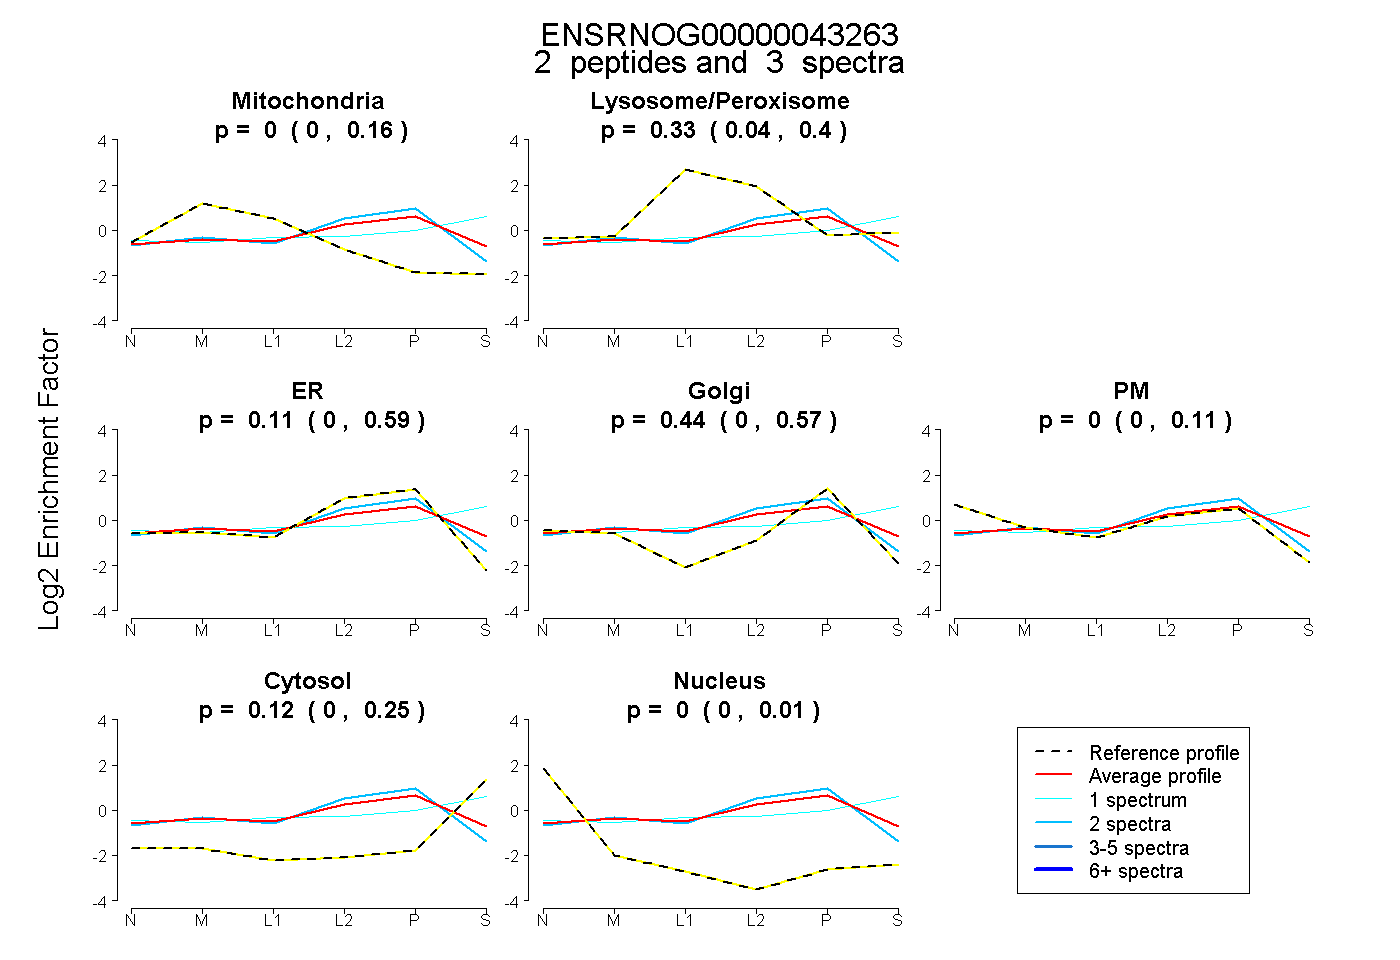
0.000 | 0.157
0.037 | 0.404
0.000 | 0.594
0.000 | 0.573
0.000 | 0.112
0.000 | 0.253
0.000 | 0.012
1peptide
spectra
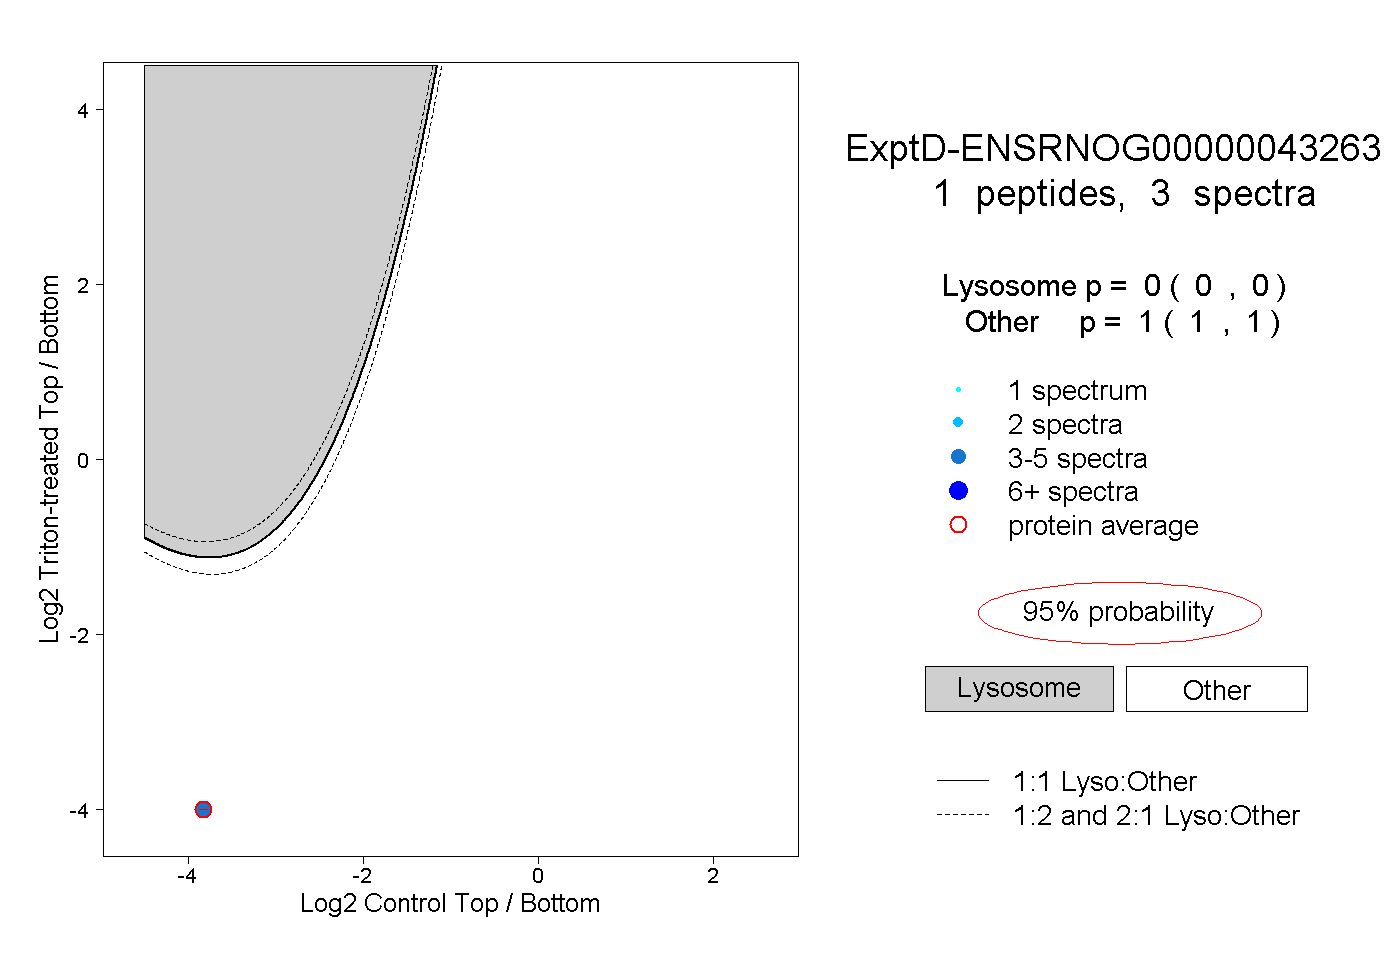
0.000 | 0.000
1.000 | 1.000