 6
6peptides
spectra
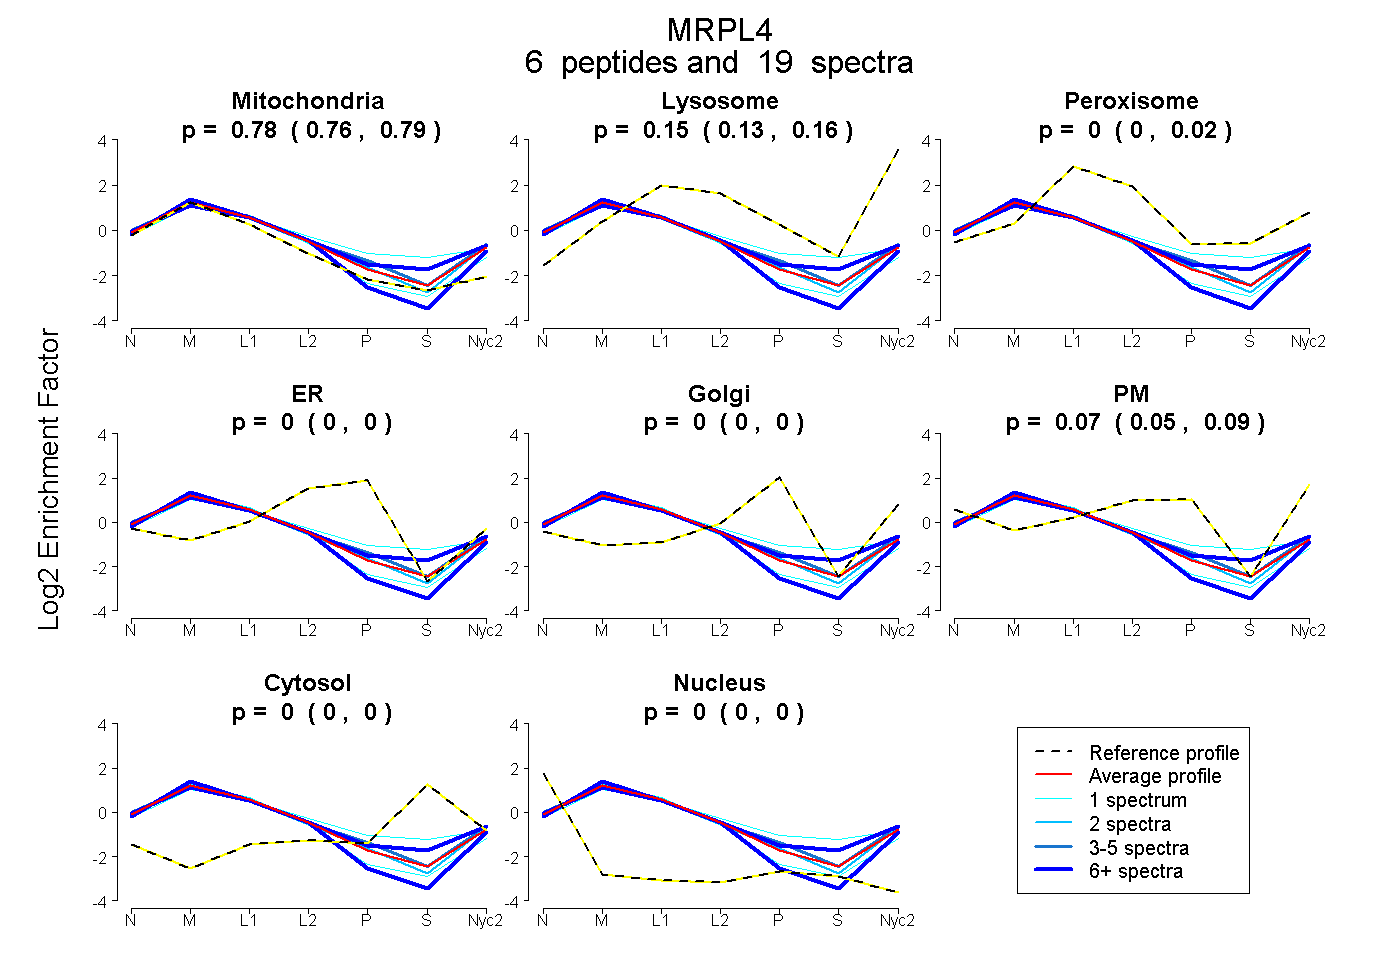
0.764 | 0.788
0.135 | 0.161
0.000 | 0.018
0.000 | 0.000
0.000 | 0.000
0.047 | 0.090
0.000 | 0.000
0.000 | 0.000
3peptides
spectra
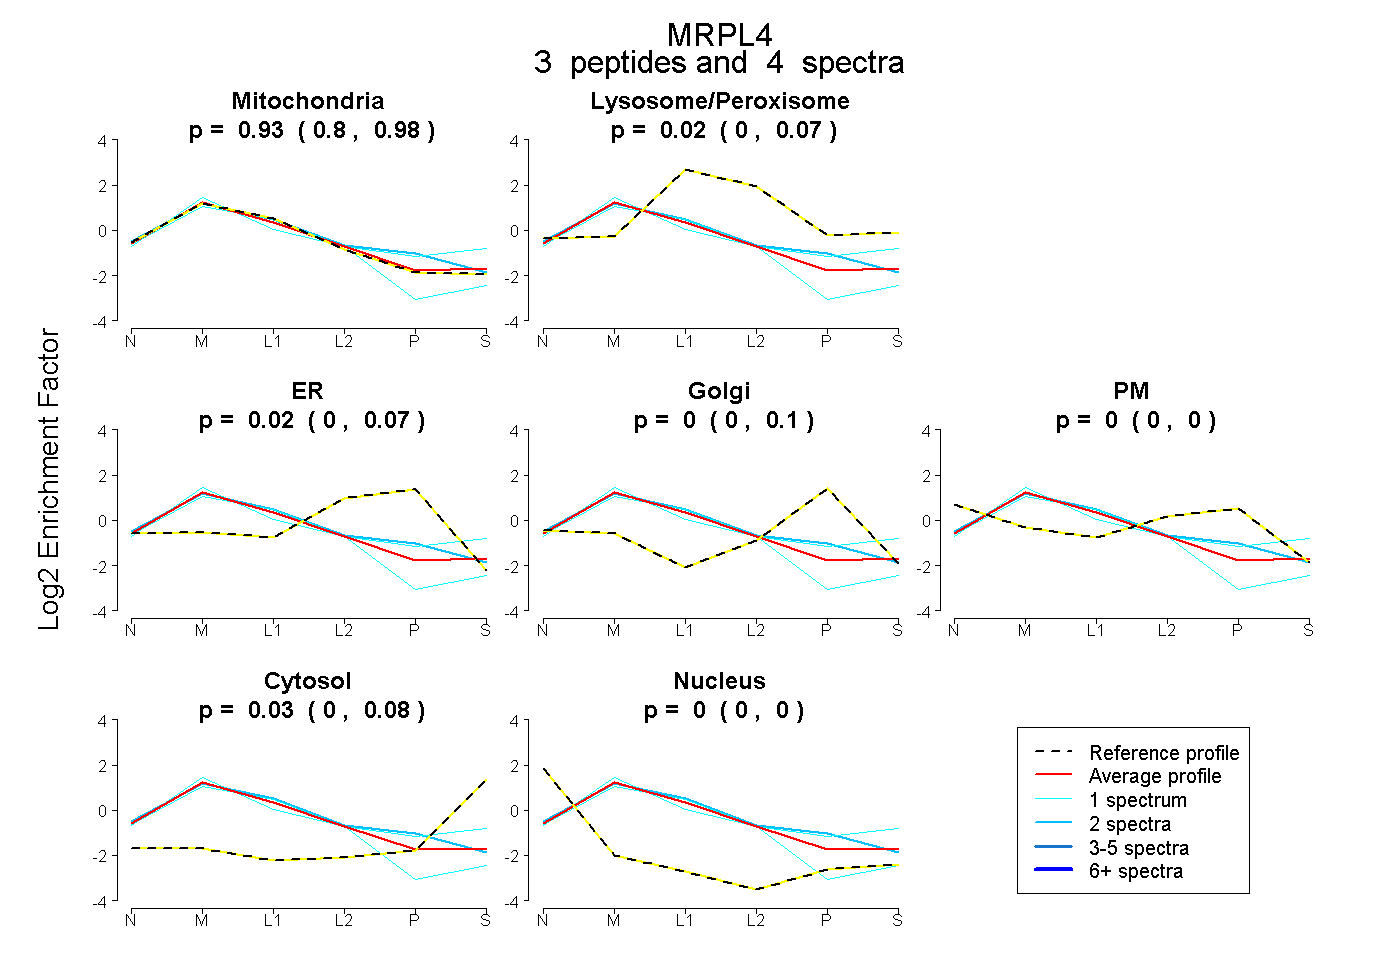
0.801 | 0.985
0.000 | 0.072
0.000 | 0.068
0.000 | 0.097
0.000 | 0.000
0.000 | 0.076
0.000 | 0.000
10peptides
spectra
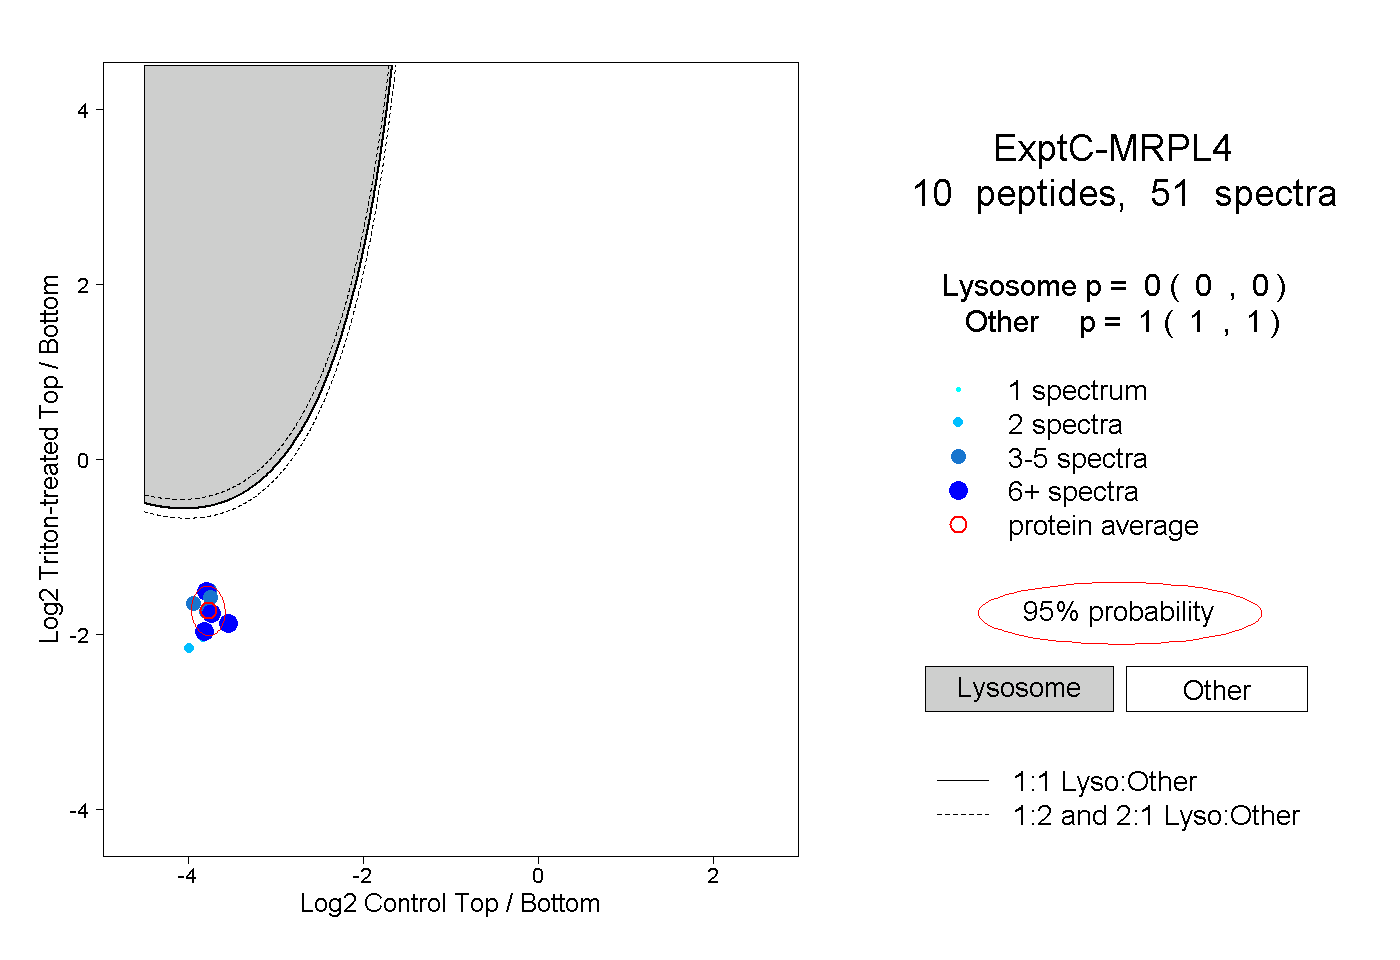
0.000 | 0.000
1.000 | 1.000
1peptide
spectrum
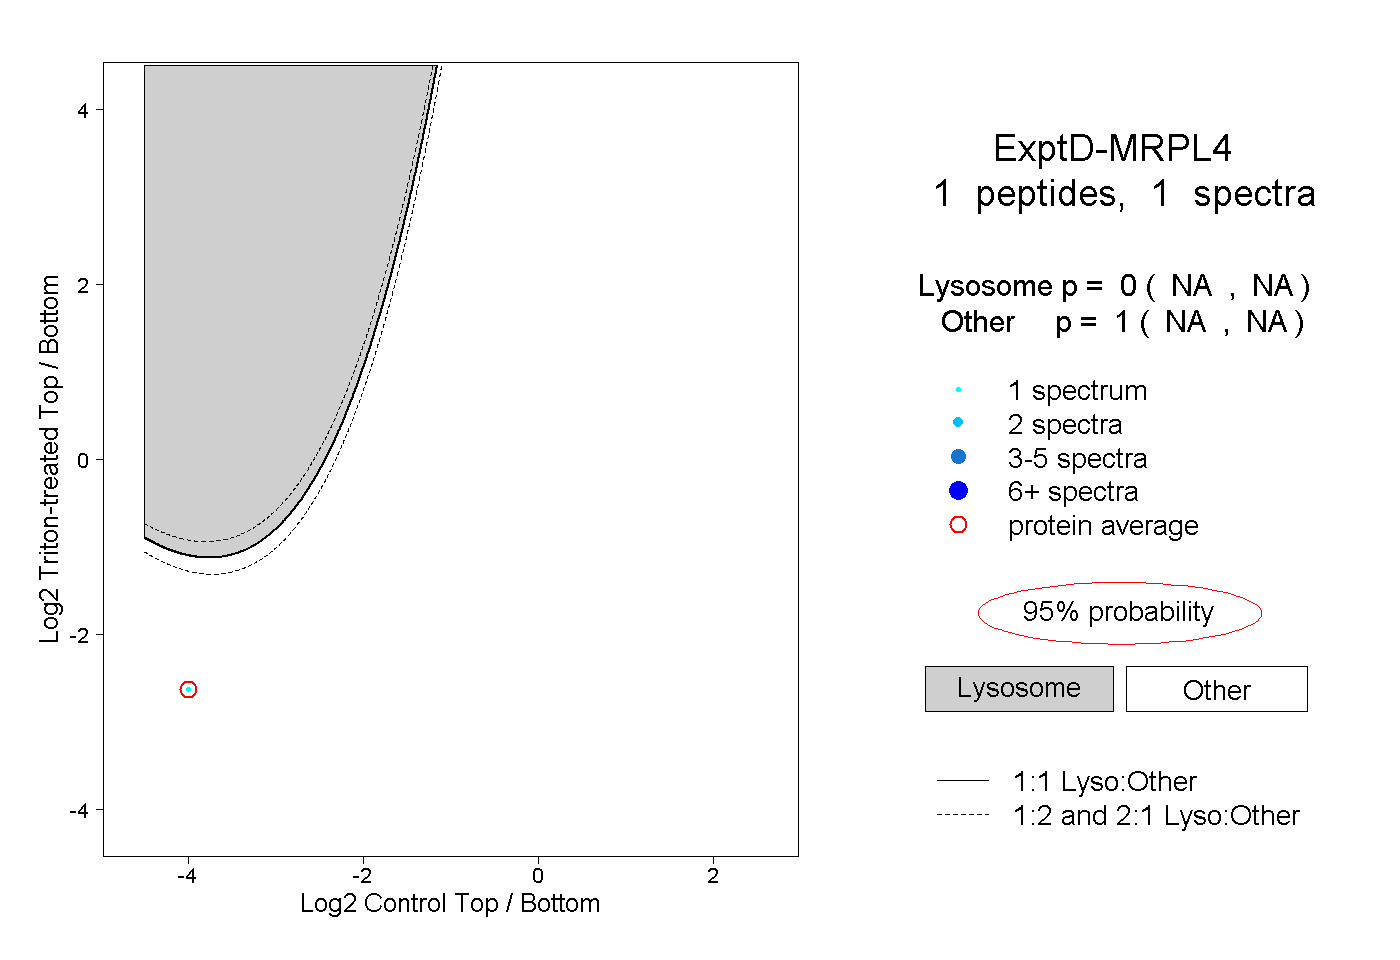
NA | NA
NA | NA