 1
1peptide
spectra
0.000 | 0.000
0.135 | 0.177
0.020 | 0.069
0.000 | 0.000
0.000 | 0.000
0.622 | 0.685
0.121 | 0.156
0.000 | 0.000
1peptide
spectrum
NA | NA
NA | NA
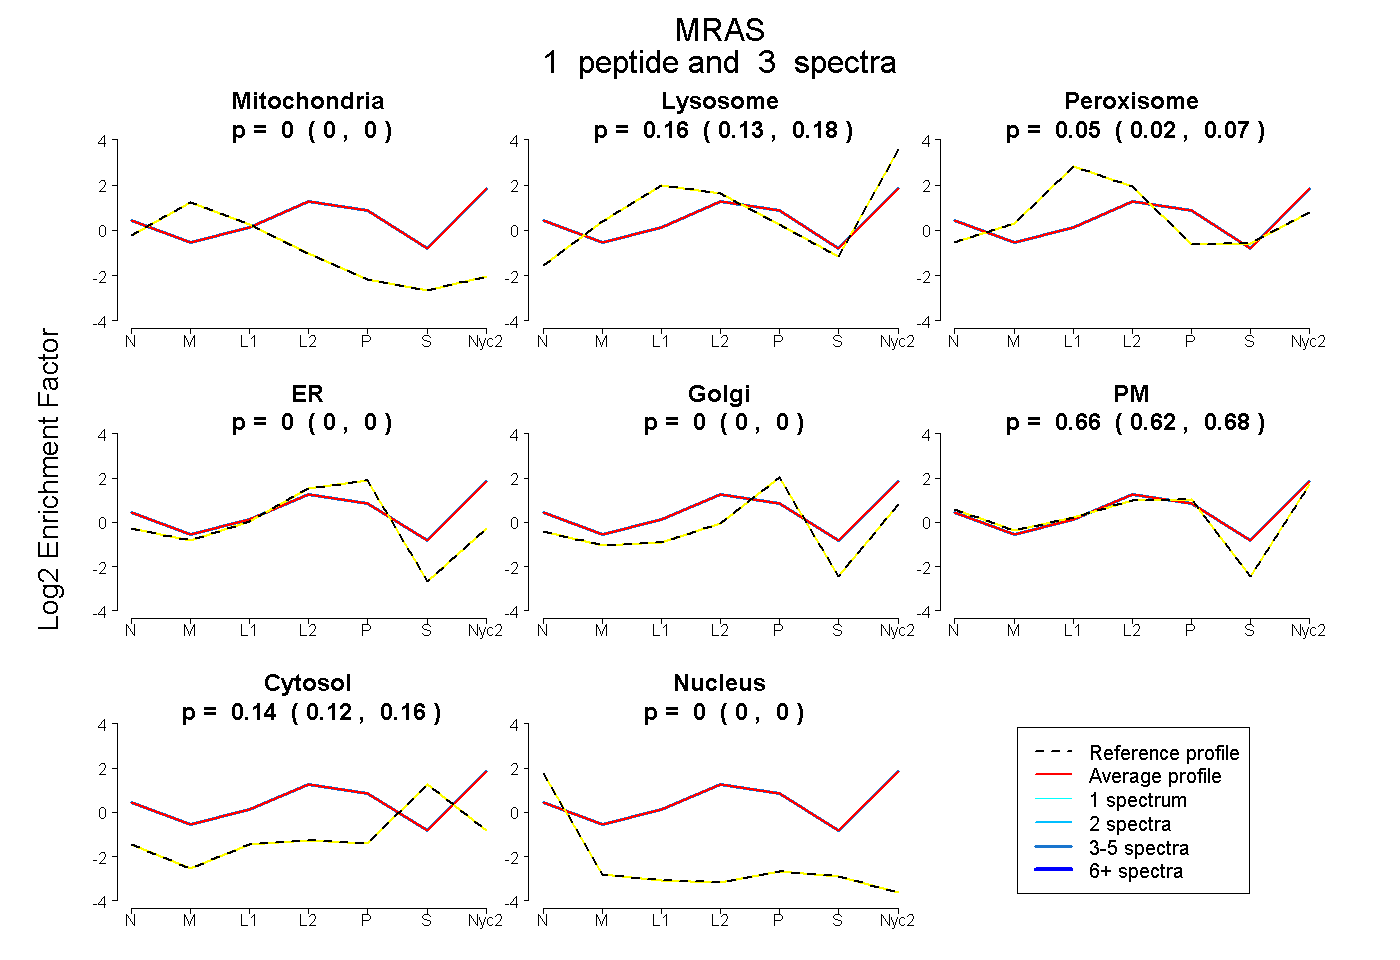
| Plot | Mito | Lyso | Perox | ER | Golgi | PM | Cytosol | Nucleus | |||||
| Expt A |
1 peptide |
3 spectra |
|
0.000 0.000 | 0.000 |
0.158 0.135 | 0.177 |
0.046 0.020 | 0.069 |
0.000 0.000 | 0.000 |
0.000 0.000 | 0.000 |
0.657 0.622 | 0.685 |
0.139 0.121 | 0.156 |
0.000 0.000 | 0.000 |
||
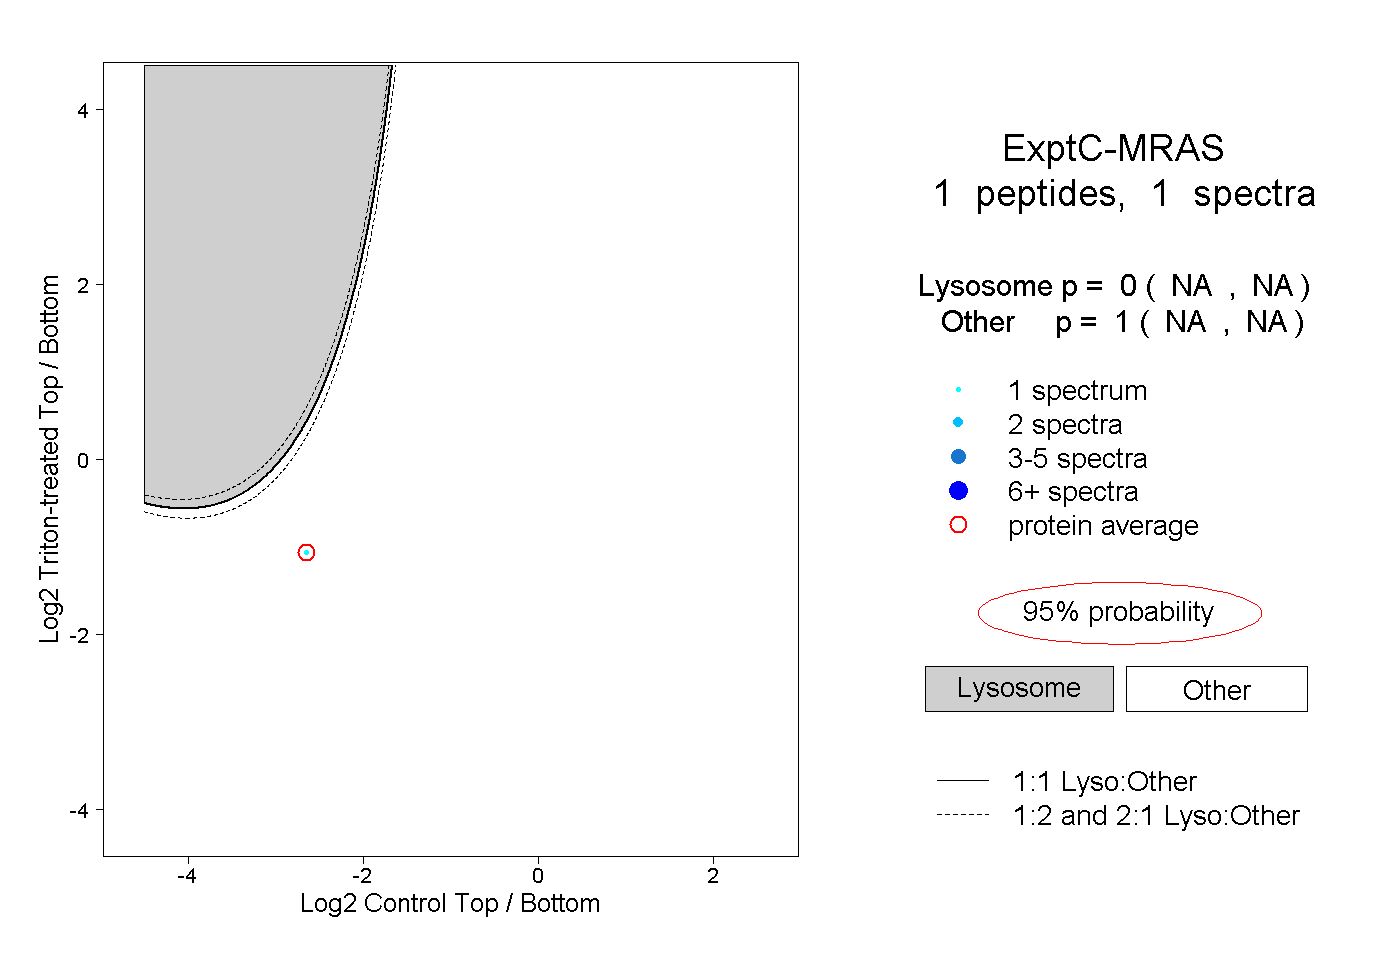
| Plot | Lyso | Other | |||||||||||
| Expt C |
1 peptide |
1 spectrum |
|
0.000 NA | NA |
1.000 NA | NA |