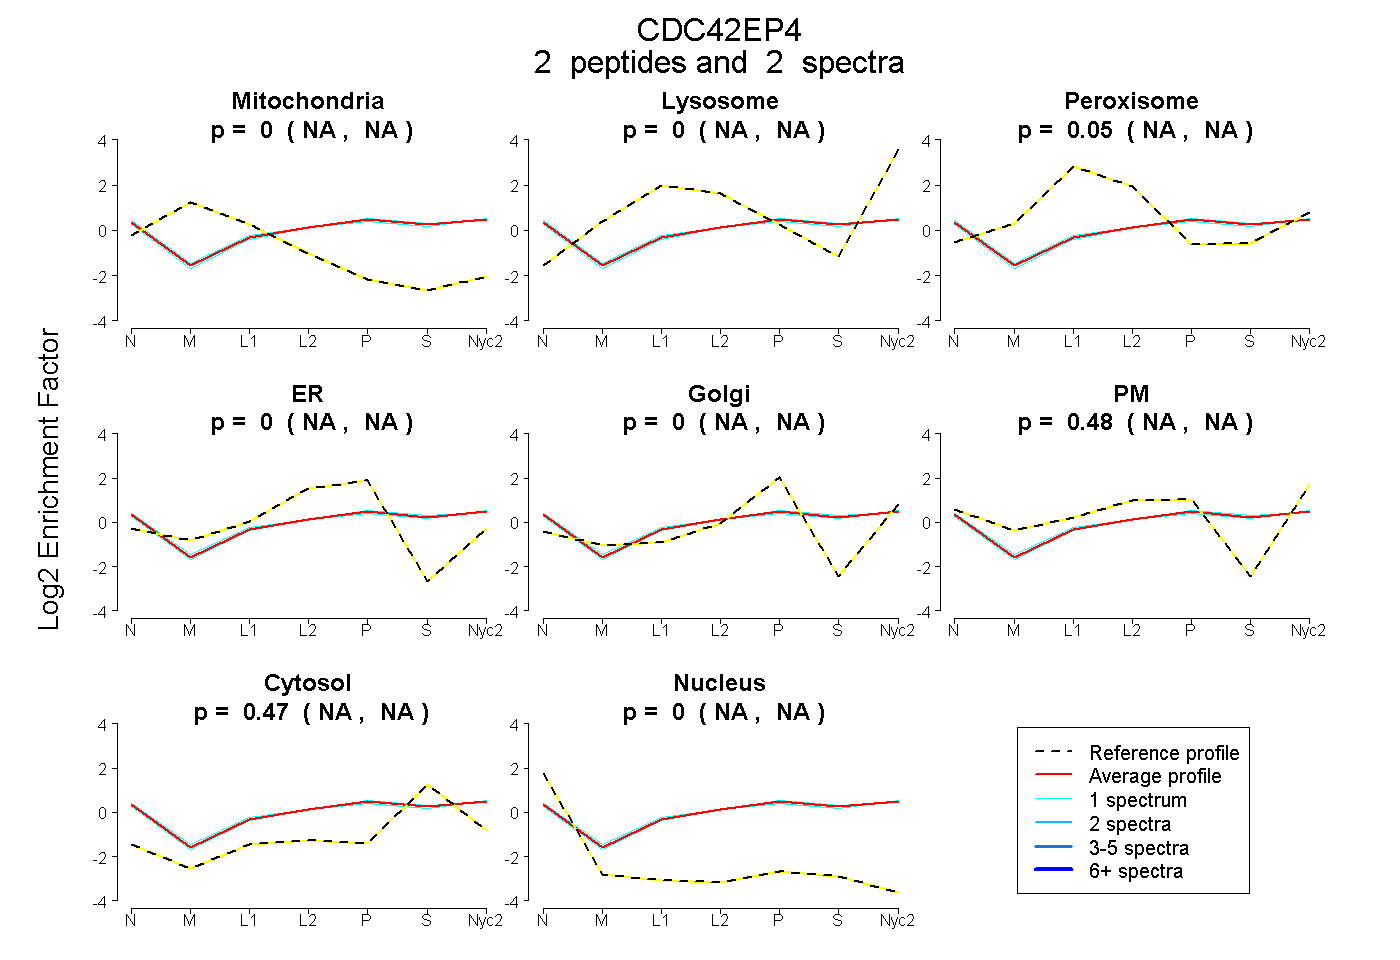
 2
2peptides
spectra
NA | NA
NA | NA
NA | NA
NA | NA
NA | NA
NA | NA
NA | NA
NA | NA
| Plot | Mito | Lyso | Perox | ER | Golgi | PM | Cytosol | Nucleus | |||||
| Expt A |
2 peptides |
2 spectra |
|
0.000 NA | NA |
0.000 NA | NA |
0.054 NA | NA |
0.000 NA | NA |
0.000 NA | NA |
0.480 NA | NA |
0.466 NA | NA |
0.000 NA | NA |
| 1 spectrum, VGAAPPR | 0.000 | 0.000 | 0.037 | 0.011 | 0.000 | 0.468 | 0.485 | 0.000 | ||
| 1 spectrum, SQSVTR | 0.000 | 0.000 | 0.072 | 0.000 | 0.000 | 0.482 | 0.446 | 0.000 |
| Plot | Lyso | Other | |||||||||||
| Expt C |
2 peptides |
4 spectra |
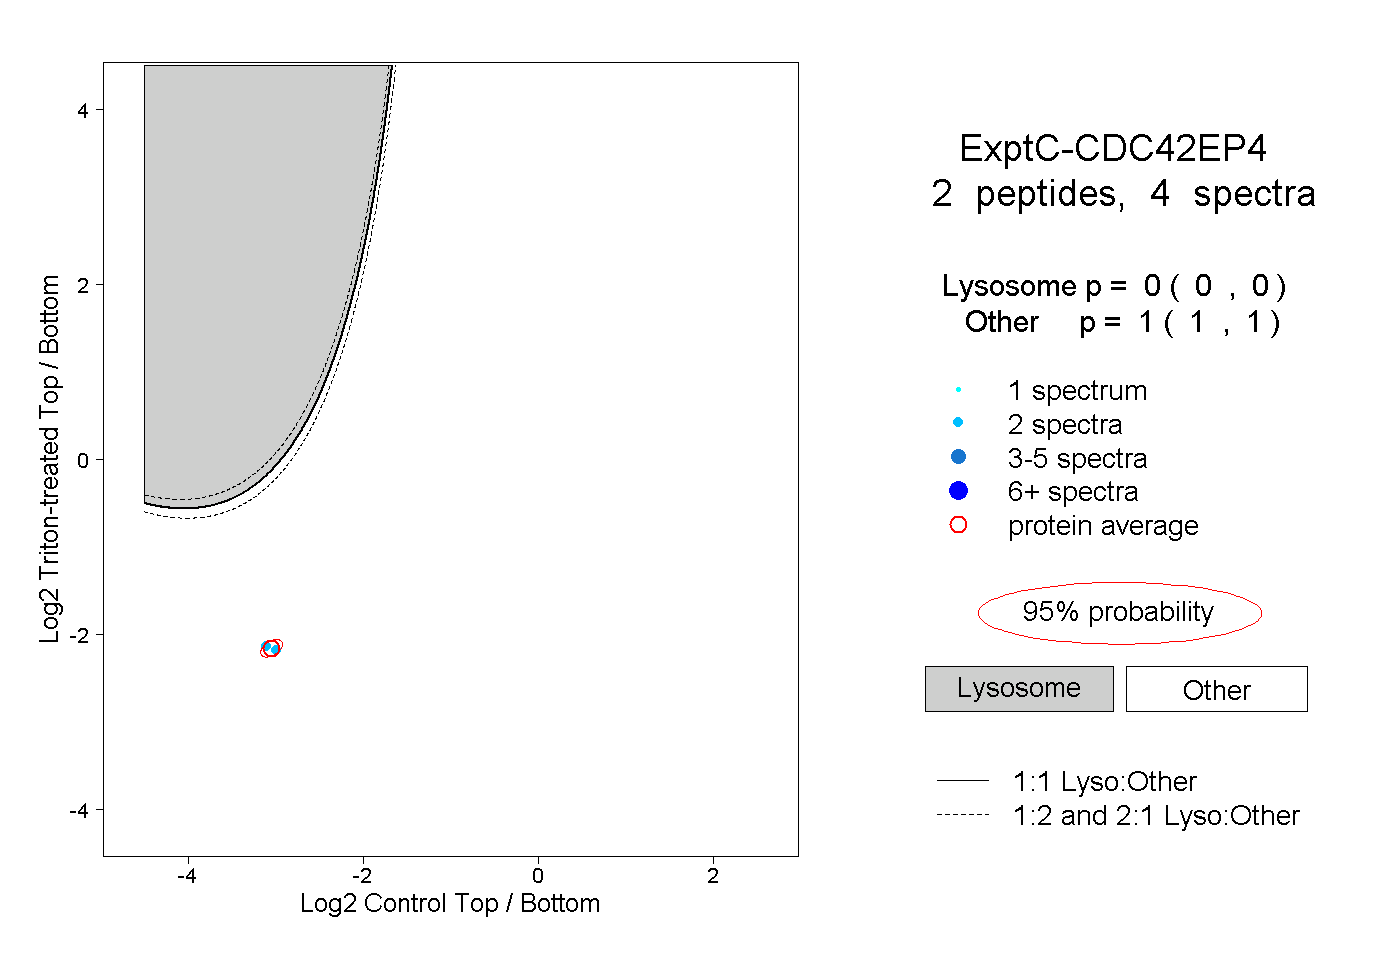 |
0.000 0.000 | 0.000 |
1.000 1.000 | 1.000 |