 4
4peptides
spectra
0.000 | 0.000
0.000 | 0.246
0.000 | 0.134
0.000 | 0.058
0.000 | 0.000
0.045 | 0.231
0.626 | 0.751
0.000 | 0.000
1peptide
spectrum
NA | NA
NA | NA
NA | NA
NA | NA
NA | NA
NA | NA
NA | NA
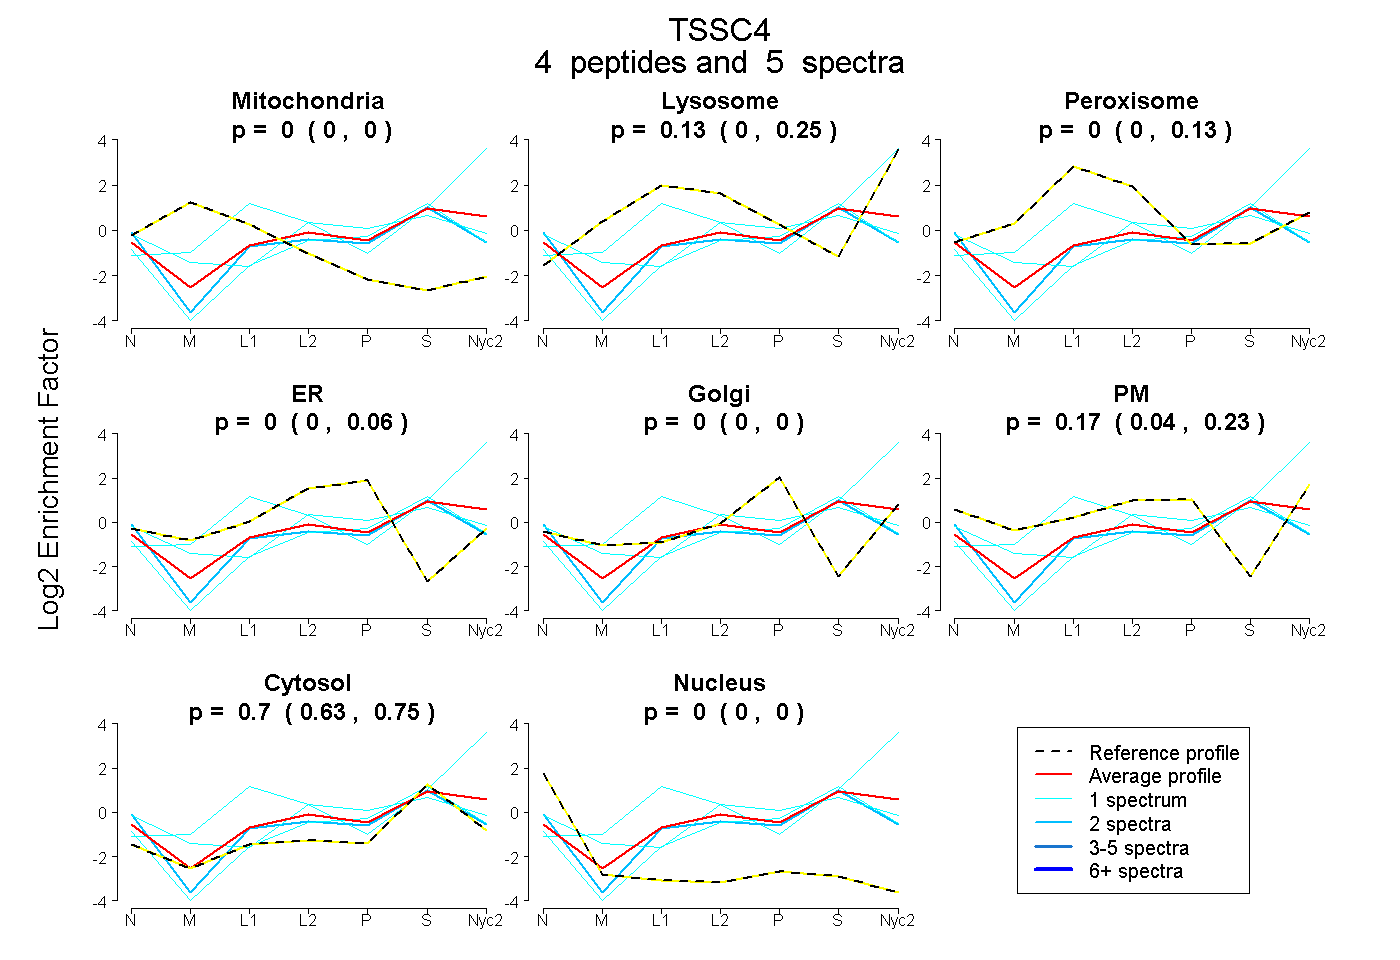
| Plot | Mito | Lyso | Perox | ER | Golgi | PM | Cytosol | Nucleus | |||||
| Expt A |
4 peptides |
5 spectra |
|
0.000 0.000 | 0.000 |
0.130 0.000 | 0.246 |
0.000 0.000 | 0.134 |
0.000 0.000 | 0.058 |
0.000 0.000 | 0.000 |
0.170 0.045 | 0.231 |
0.700 0.626 | 0.751 |
0.000 0.000 | 0.000 |
||
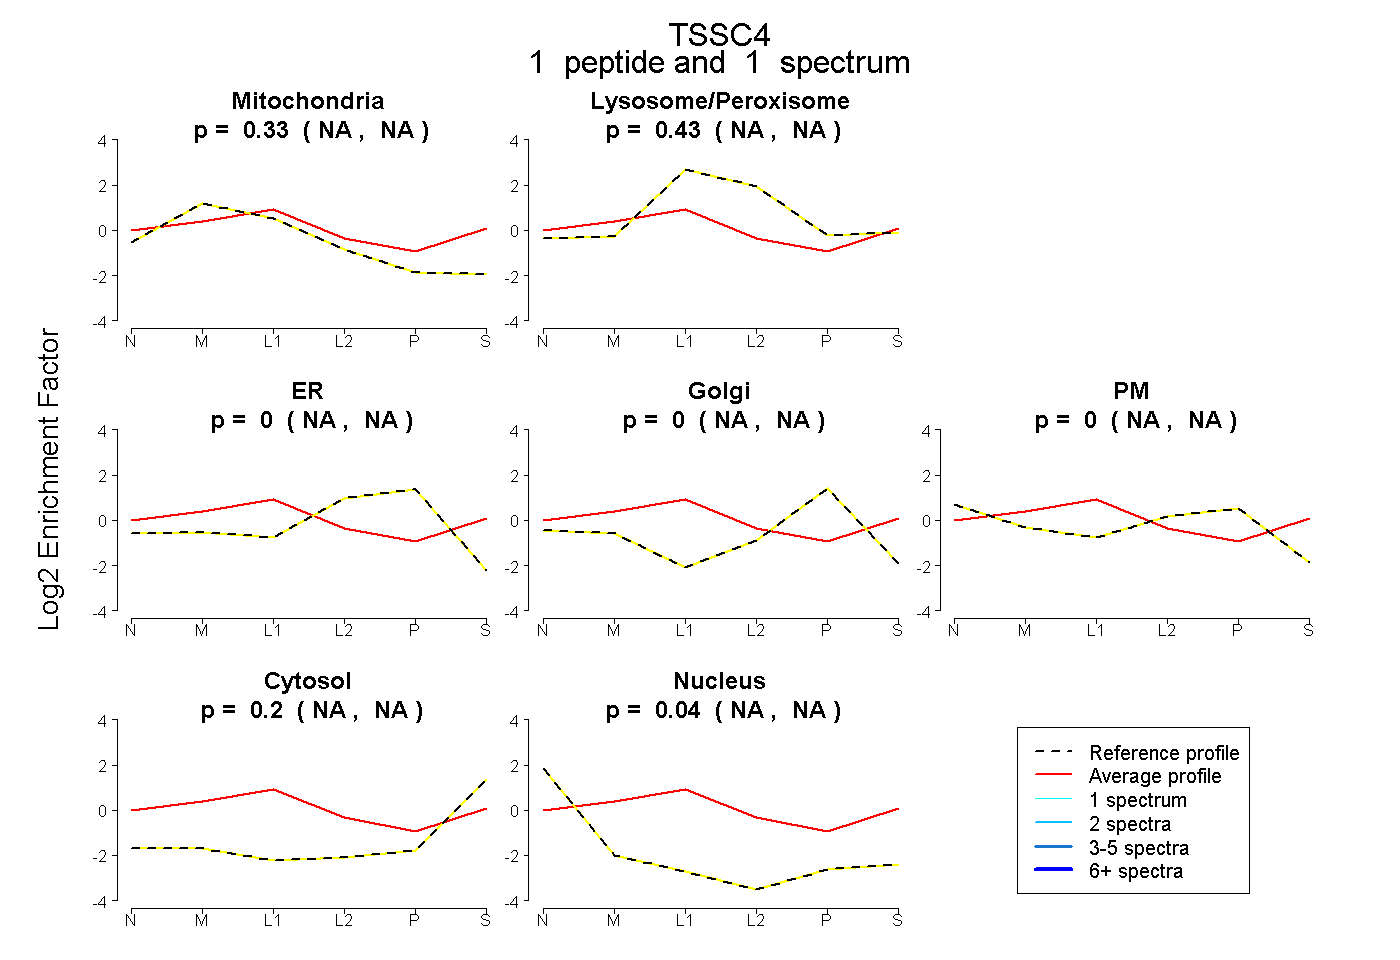
| Plot | Mito | Lyso or Perox | ER | Golgi | PM | Cytosol | Nucleus | ||||||
| Expt B |
1 peptide |
1 spectrum |
|
0.334 NA | NA |
0.431 NA | NA |
0.000 NA | NA |
0.000 NA | NA |
0.004 NA | NA |
0.196 NA | NA |
0.036 NA | NA |