 8
8peptides
spectra
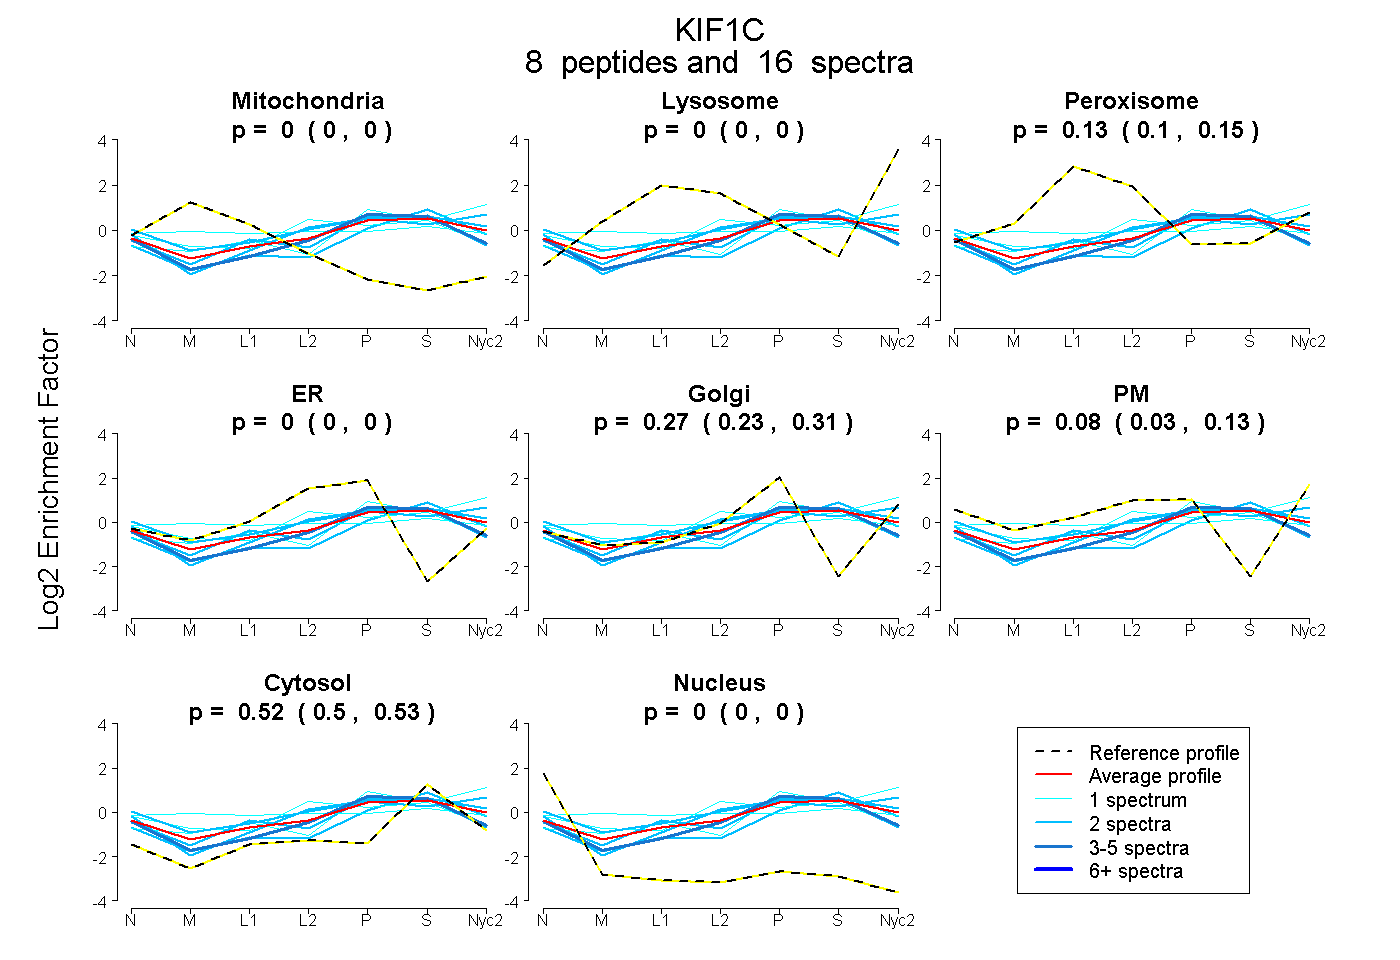
0.000 | 0.000
0.000 | 0.000
0.104 | 0.148
0.000 | 0.000
0.231 | 0.309
0.029 | 0.126
0.502 | 0.531
0.000 | 0.000
| Plot | Mito | Lyso | Perox | ER | Golgi | PM | Cytosol | Nucleus | |||||
| Expt A |
8 peptides |
16 spectra |
|
0.000 0.000 | 0.000 |
0.000 0.000 | 0.000 |
0.128 0.104 | 0.148 |
0.000 0.000 | 0.000 |
0.274 0.231 | 0.309 |
0.081 0.029 | 0.126 |
0.518 0.502 | 0.531 |
0.000 0.000 | 0.000 |
| 2 spectra, AEIEALAALK | 0.000 | 0.012 | 0.003 | 0.000 | 0.257 | 0.016 | 0.711 | 0.000 | ||
| 2 spectra, LMEEDPAFR | 0.000 | 0.000 | 0.000 | 0.112 | 0.019 | 0.293 | 0.577 | 0.000 | ||
| 1 spectrum, GVPPPPGPPSEPVDWNFAQK | 0.000 | 0.179 | 0.000 | 0.000 | 0.000 | 0.369 | 0.452 | 0.000 | ||
| 1 spectrum, NSLDGGSR | 0.114 | 0.000 | 0.254 | 0.000 | 0.102 | 0.157 | 0.374 | 0.000 | ||
| 1 spectrum, ELLEQQGIDIK | 0.006 | 0.000 | 0.105 | 0.000 | 0.385 | 0.000 | 0.504 | 0.000 | ||
| 2 spectra, SCEESWR | 0.000 | 0.037 | 0.033 | 0.000 | 0.000 | 0.478 | 0.452 | 0.000 | ||
| 2 spectra, LQDLENQYR | 0.000 | 0.000 | 0.104 | 0.109 | 0.208 | 0.000 | 0.578 | 0.000 | ||
| 5 spectra, VRPFNAR | 0.000 | 0.000 | 0.000 | 0.182 | 0.213 | 0.000 | 0.605 | 0.000 |
| Plot | Mito | Lyso or Perox | ER | Golgi | PM | Cytosol | Nucleus | ||||||
| Expt B |
2 peptides |
3 spectra |
 |
0.000 0.000 | 0.000 |
0.176 0.151 | 0.189 |
0.000 0.000 | 0.040 |
0.453 0.404 | 0.463 |
0.000 0.000 | 0.000 |
0.371 0.357 | 0.385 |
0.000 0.000 | 0.000 |
|||
| Plot | Lyso | Other | |||||||||||
| Expt C |
4 peptides |
9 spectra |
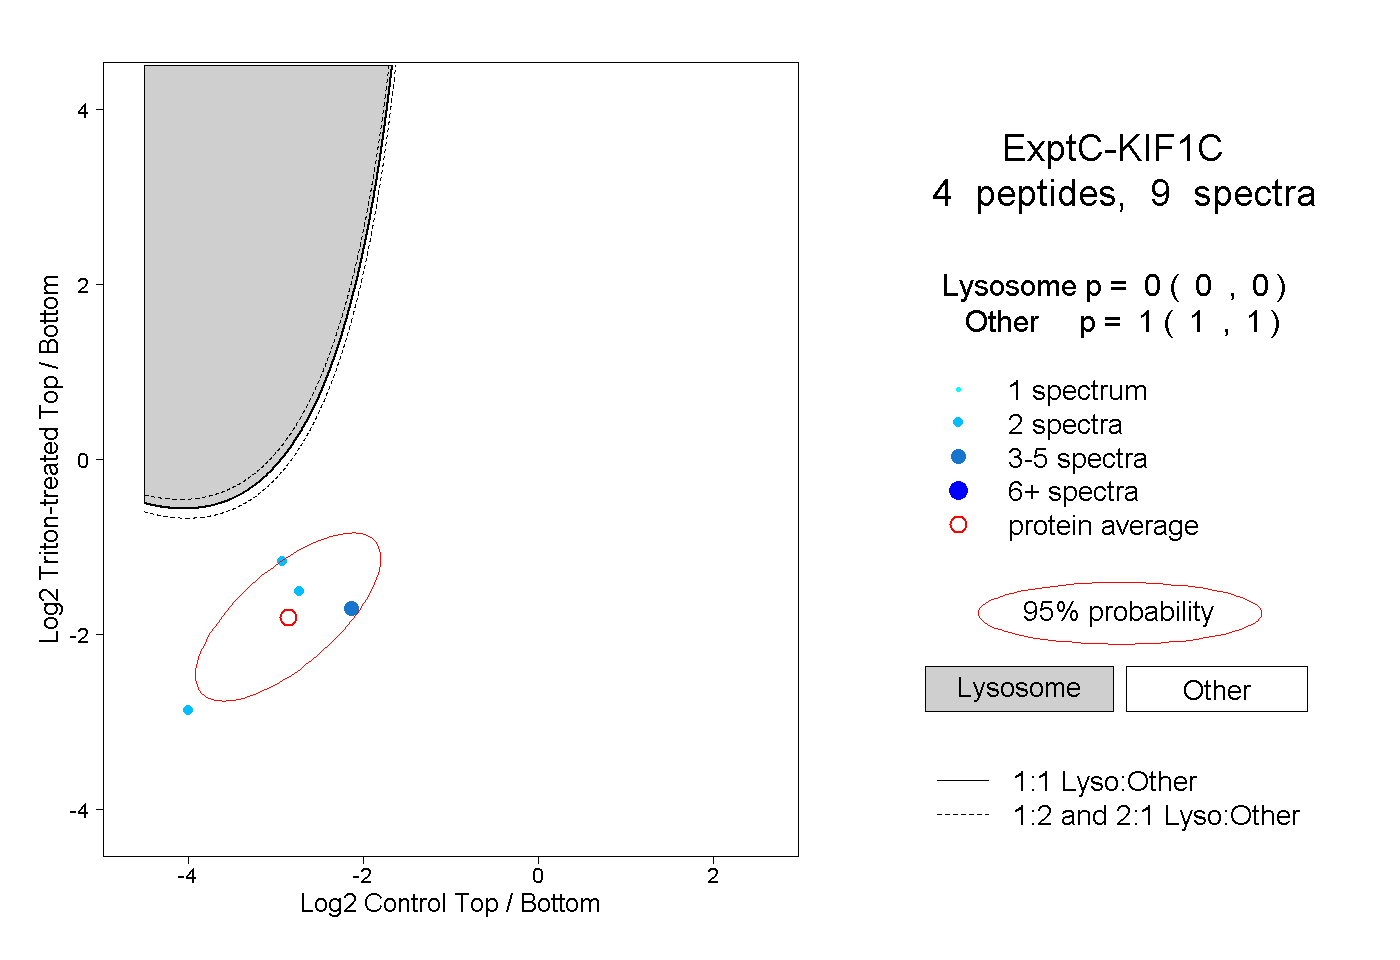 |
0.000 0.000 | 0.000 |
1.000 1.000 | 1.000 |
||||||||
| Plot | Lyso | Other | |||||||||||
| Expt D |
2 peptides |
2 spectra |
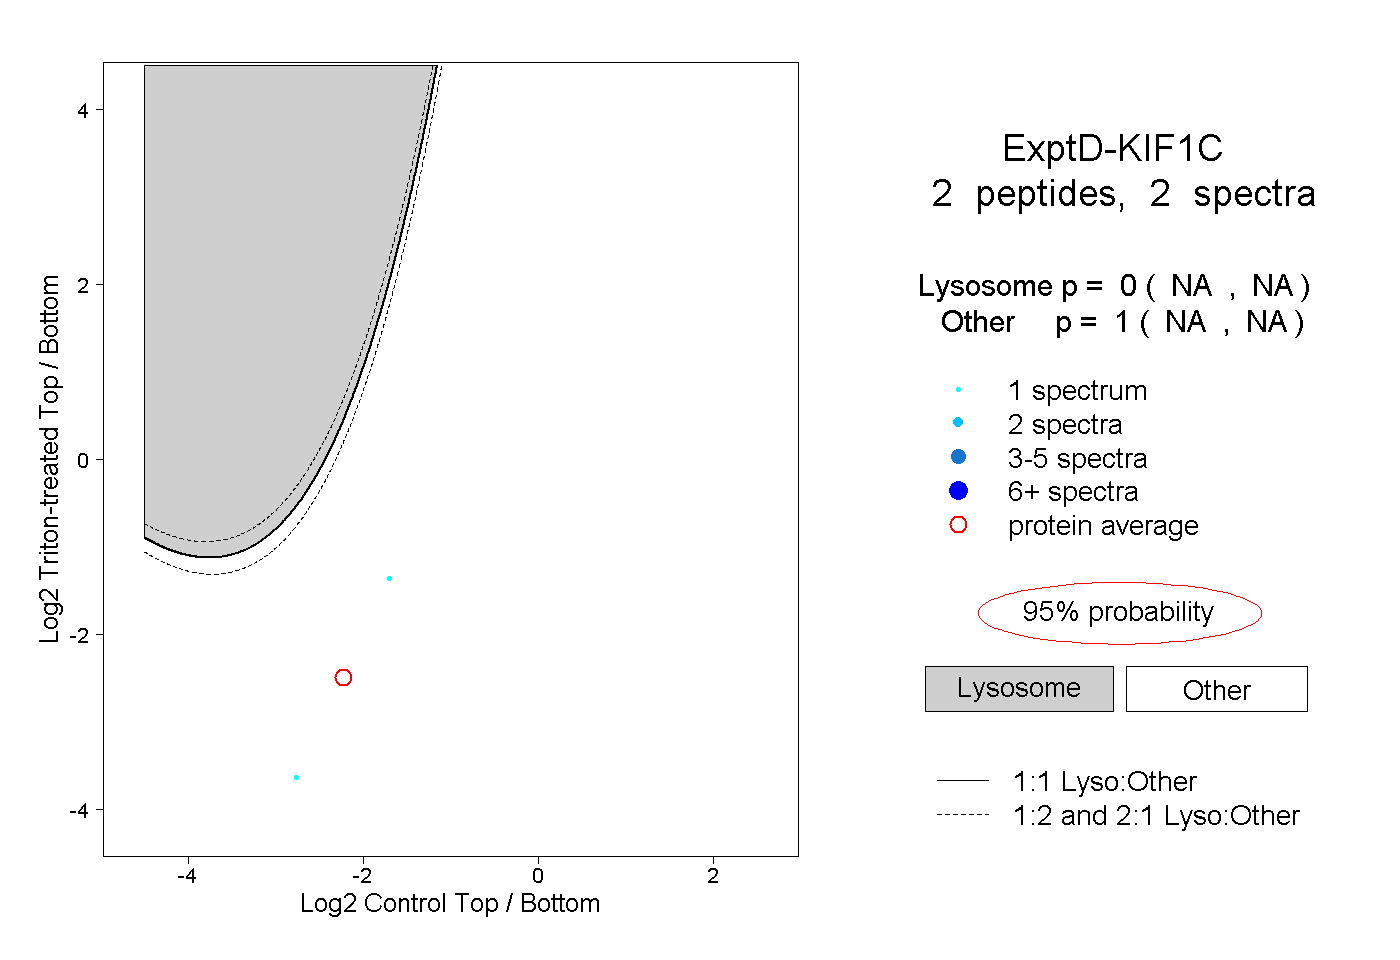 |
0.000 NA | NA |
1.000 NA | NA |