 5
5peptides
spectra
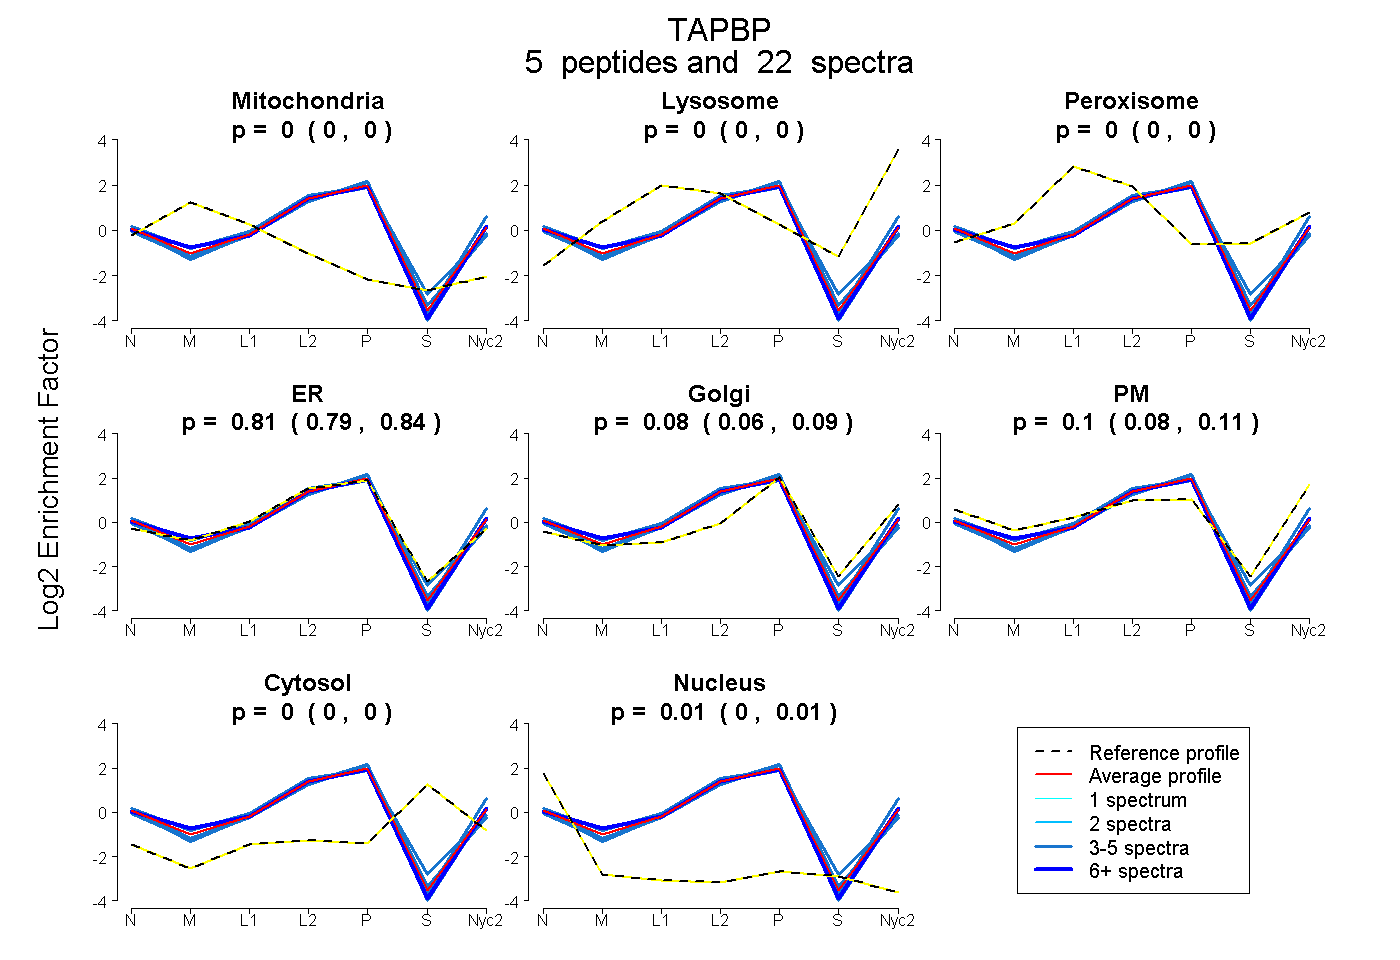
0.000 | 0.000
0.000 | 0.000
0.000 | 0.000
0.790 | 0.835
0.063 | 0.092
0.079 | 0.113
0.000 | 0.000
0.004 | 0.013
4peptides
spectra
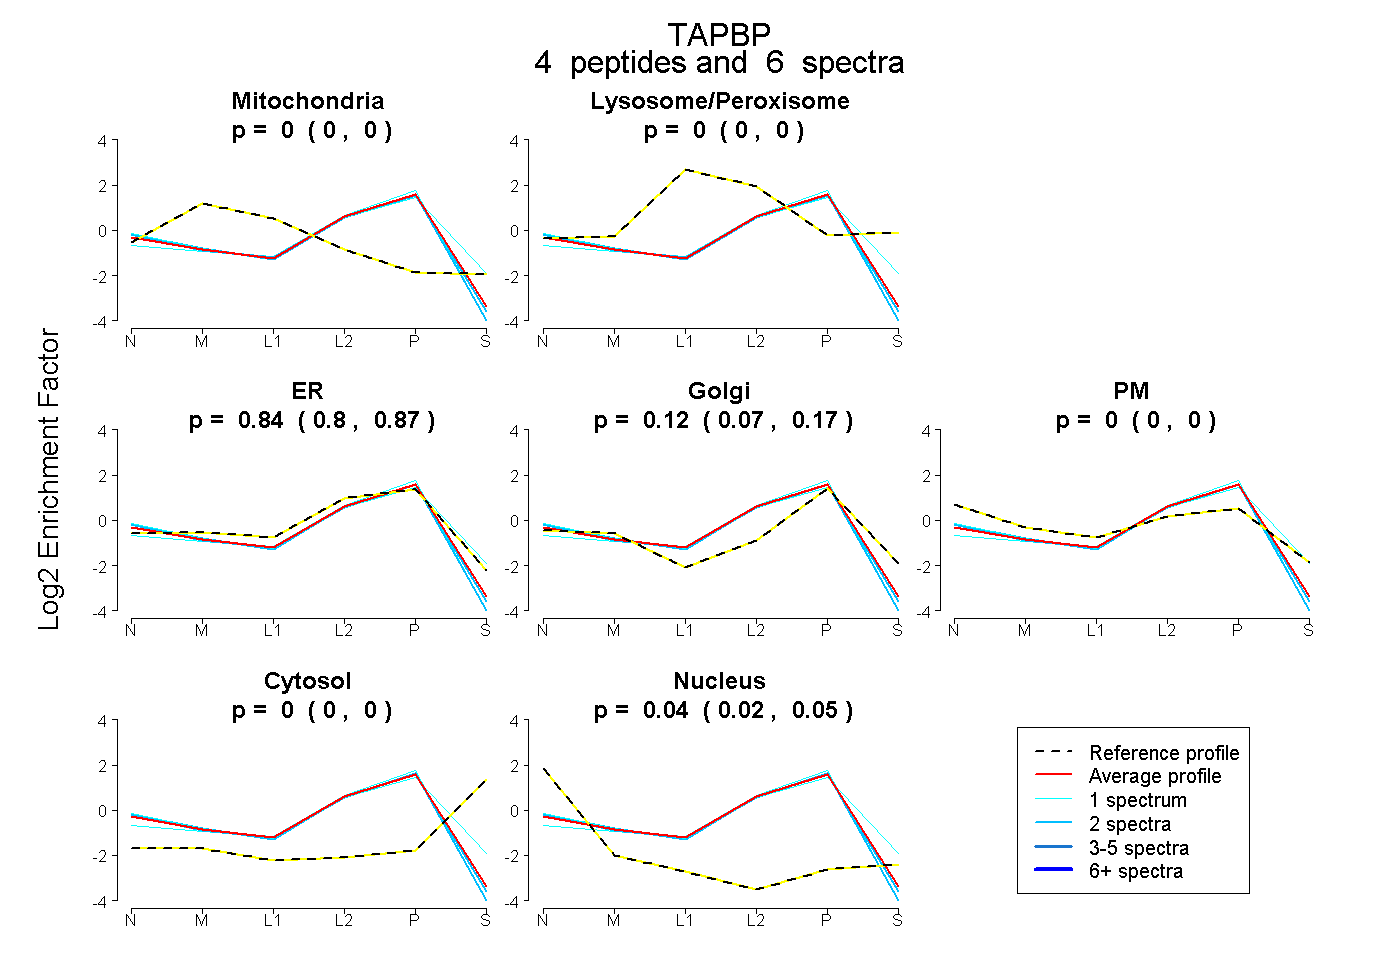
0.000 | 0.000
0.000 | 0.000
0.803 | 0.870
0.072 | 0.171
0.000 | 0.000
0.000 | 0.000
0.018 | 0.050
5peptides
spectra
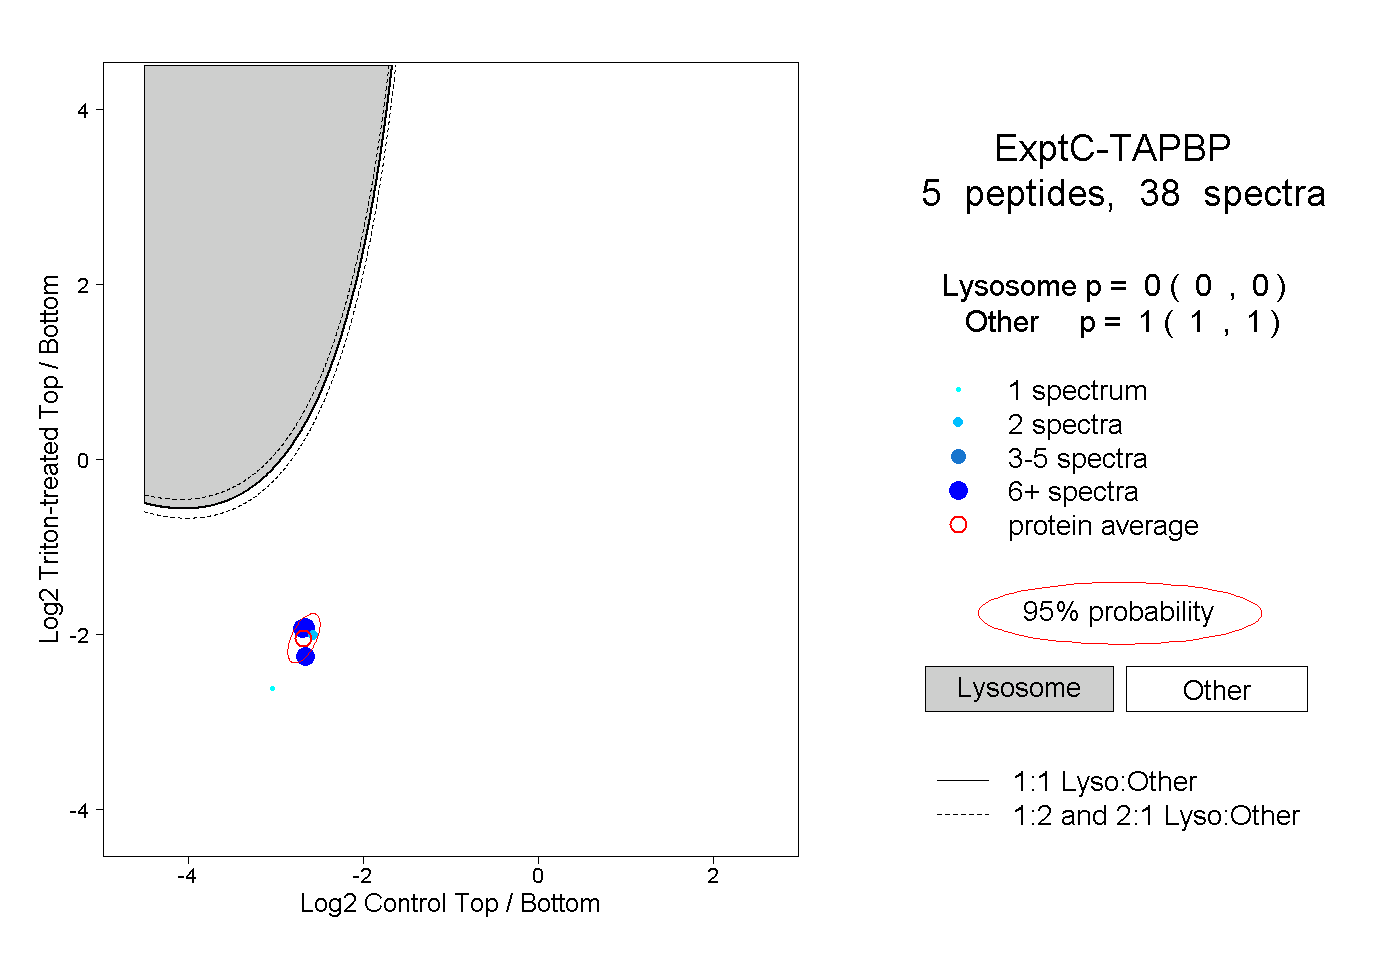
0.000 | 0.000
1.000 | 1.000
2peptides
spectra
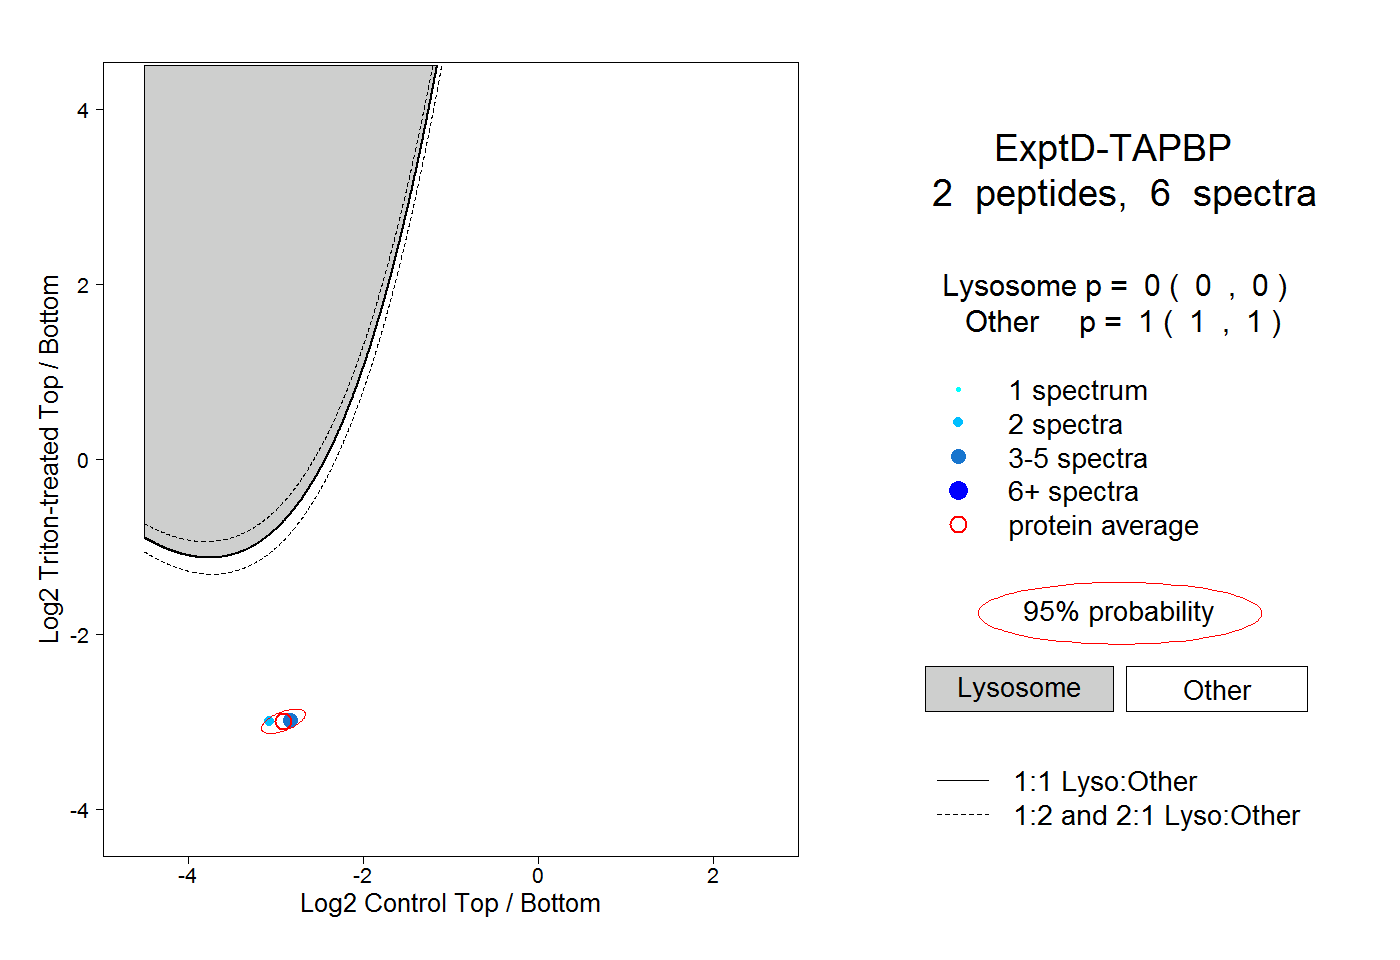
0.000 | 0.000
1.000 | 1.000