15
15peptides
spectra
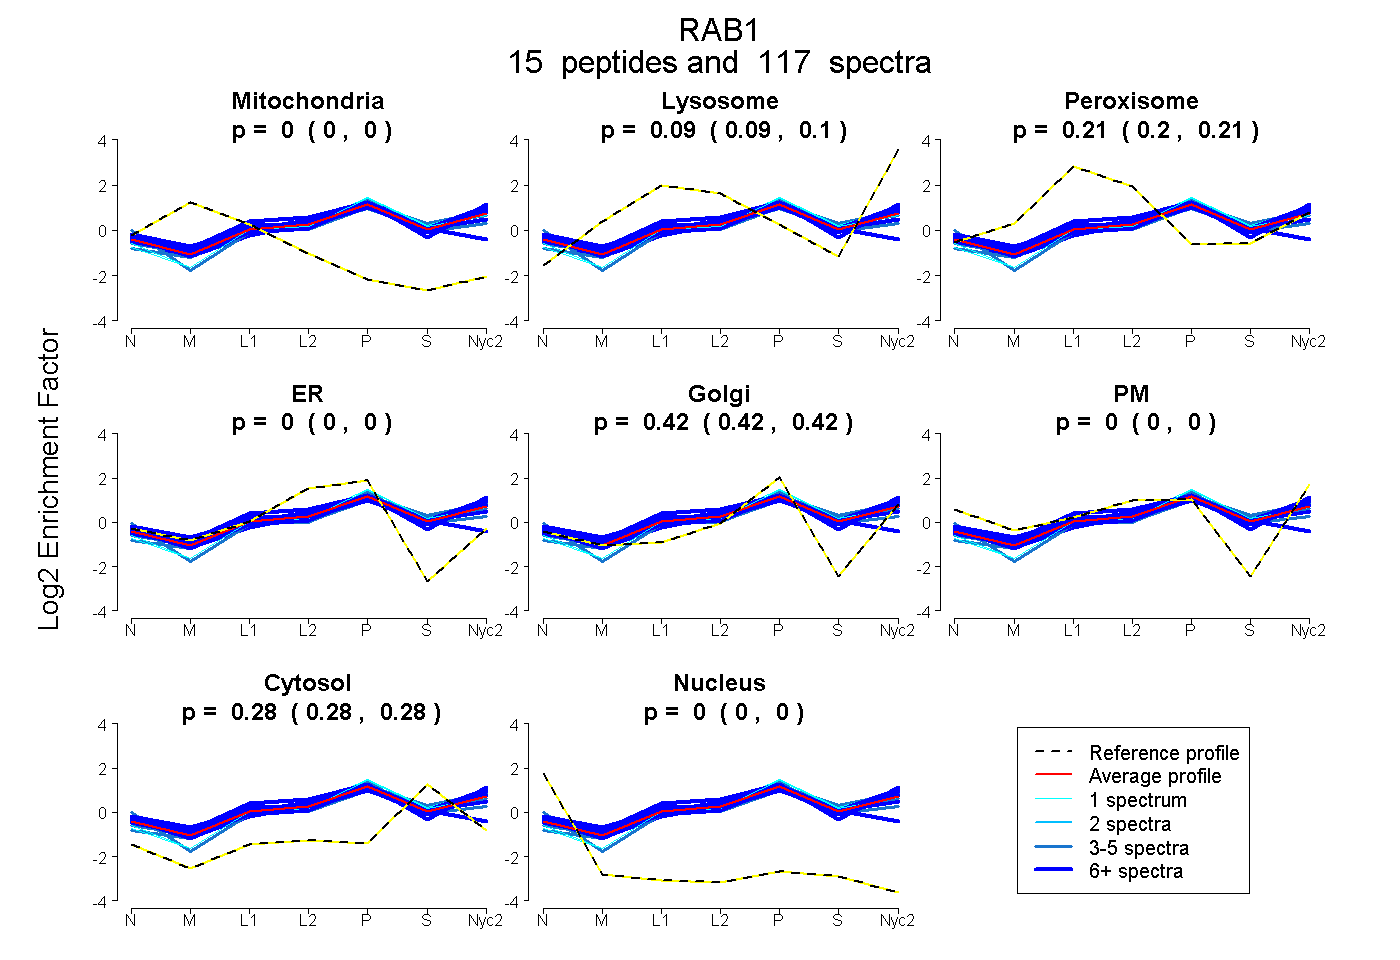
0.000 | 0.000
0.088 | 0.100
0.201 | 0.211
0.000 | 0.000
0.417 | 0.421
0.000 | 0.000
0.278 | 0.281
0.000 | 0.000
13peptides
spectra
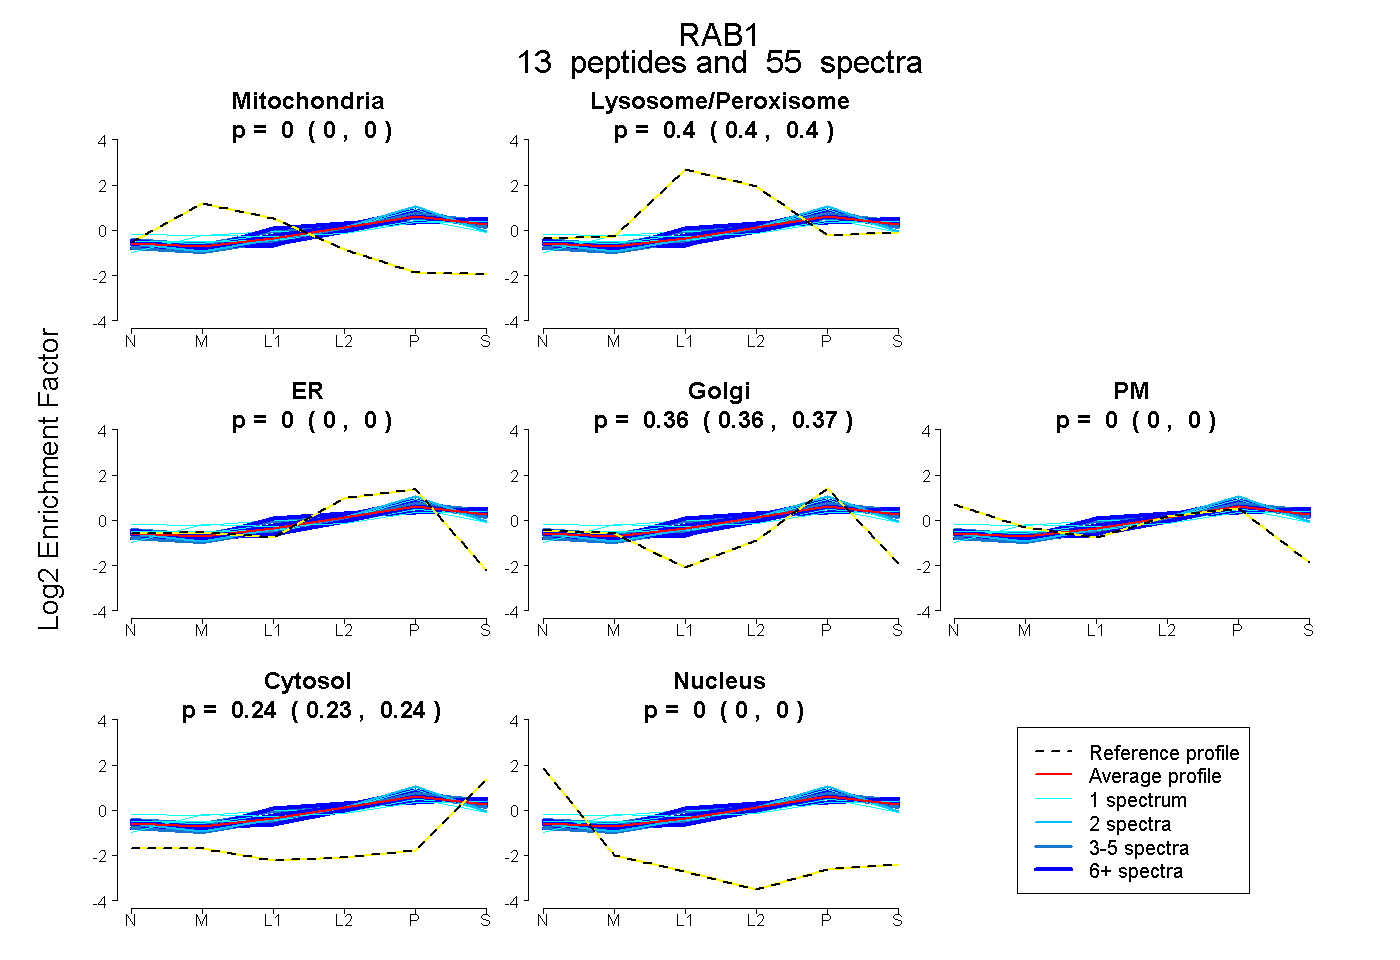
0.000 | 0.000
0.397 | 0.403
0.000 | 0.000
0.359 | 0.365
0.000 | 0.000
0.235 | 0.240
0.000 | 0.000