 30
30peptides
spectra
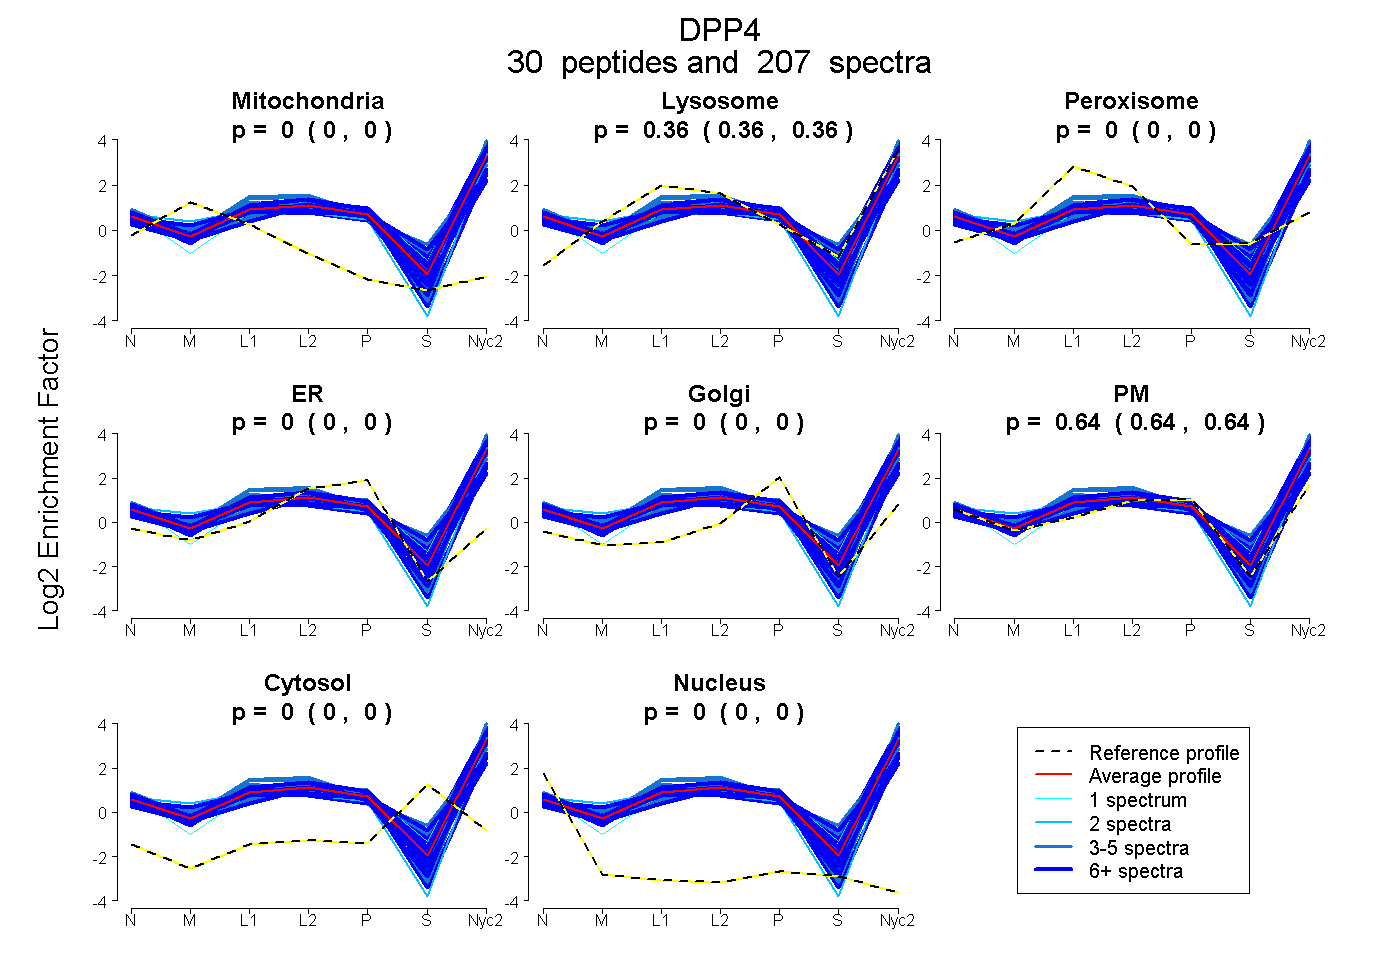
0.000 | 0.000
0.356 | 0.361
0.000 | 0.000
0.000 | 0.000
0.000 | 0.000
0.639 | 0.644
0.000 | 0.000
0.000 | 0.000
22peptides
spectra
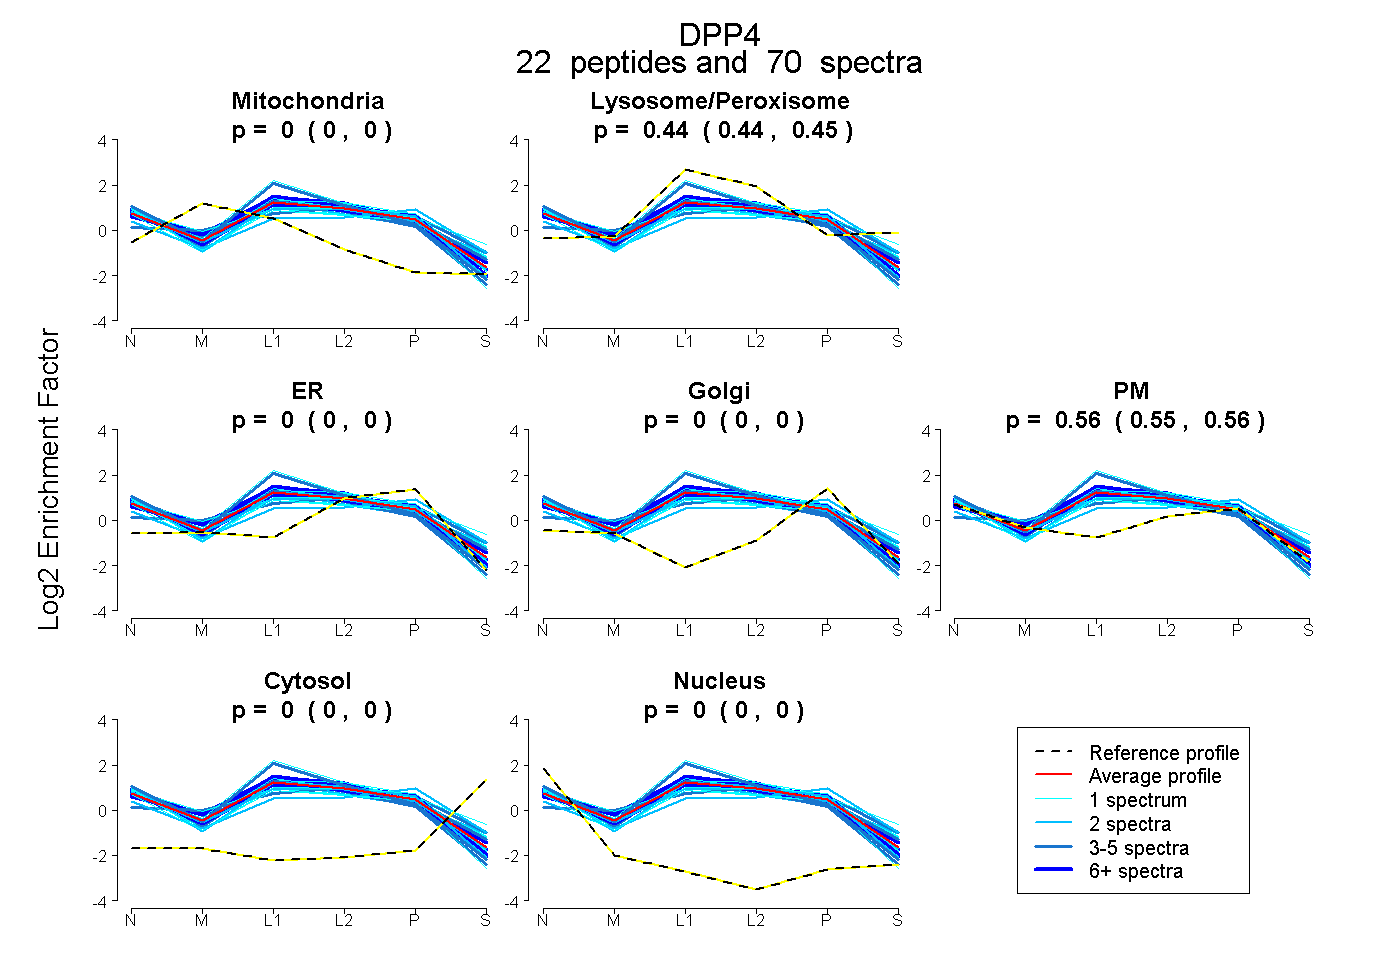
0.000 | 0.000
0.438 | 0.445
0.000 | 0.000
0.000 | 0.000
0.554 | 0.561
0.000 | 0.000
0.000 | 0.000
30peptides
spectra
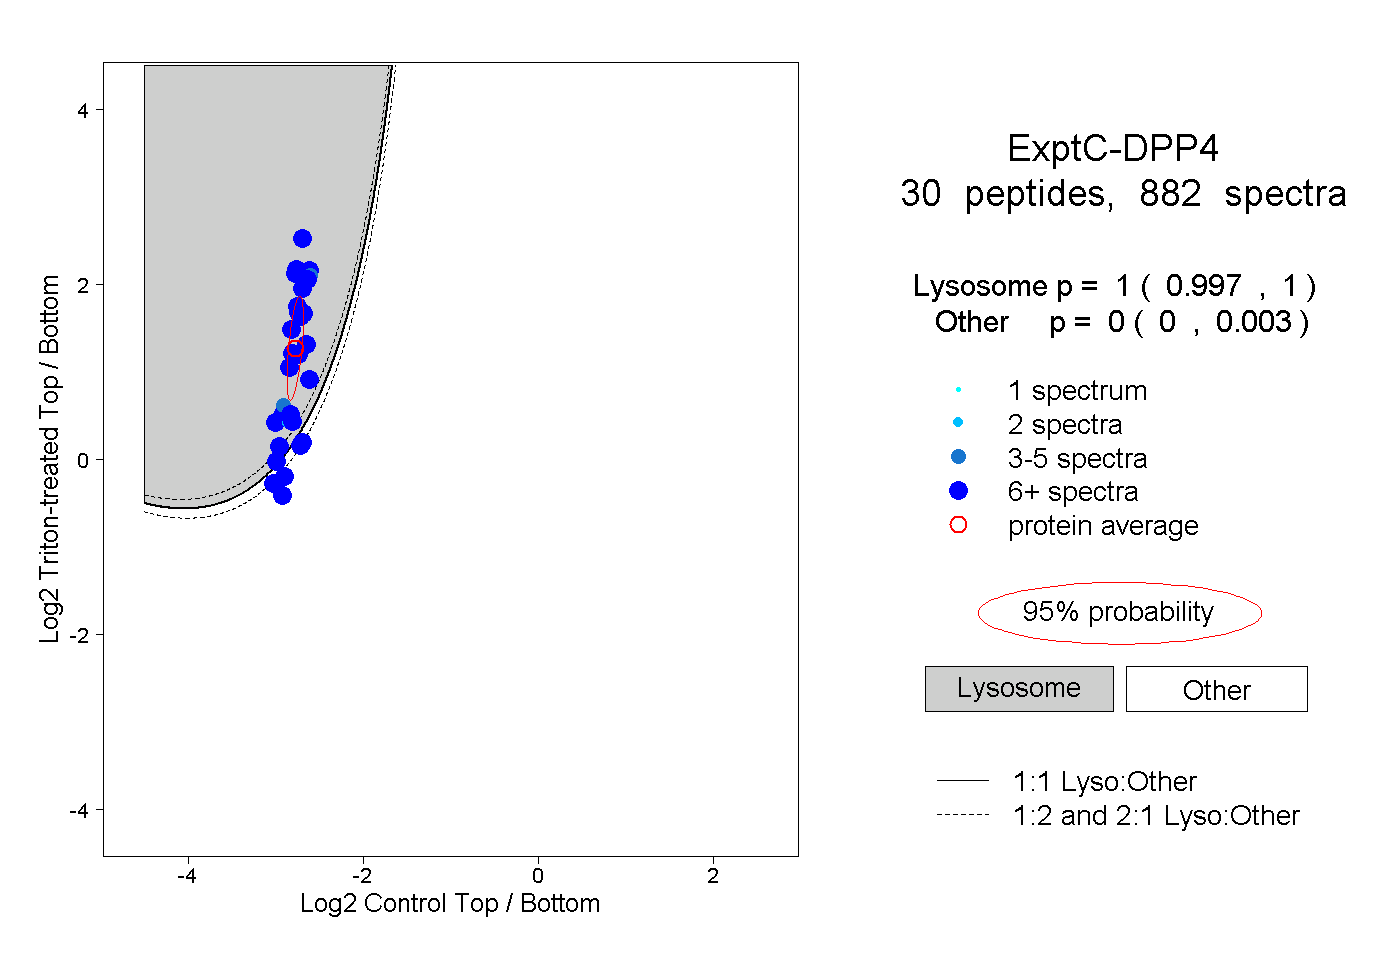
0.997 | 1.000
0.000 | 0.003
20peptides
spectra
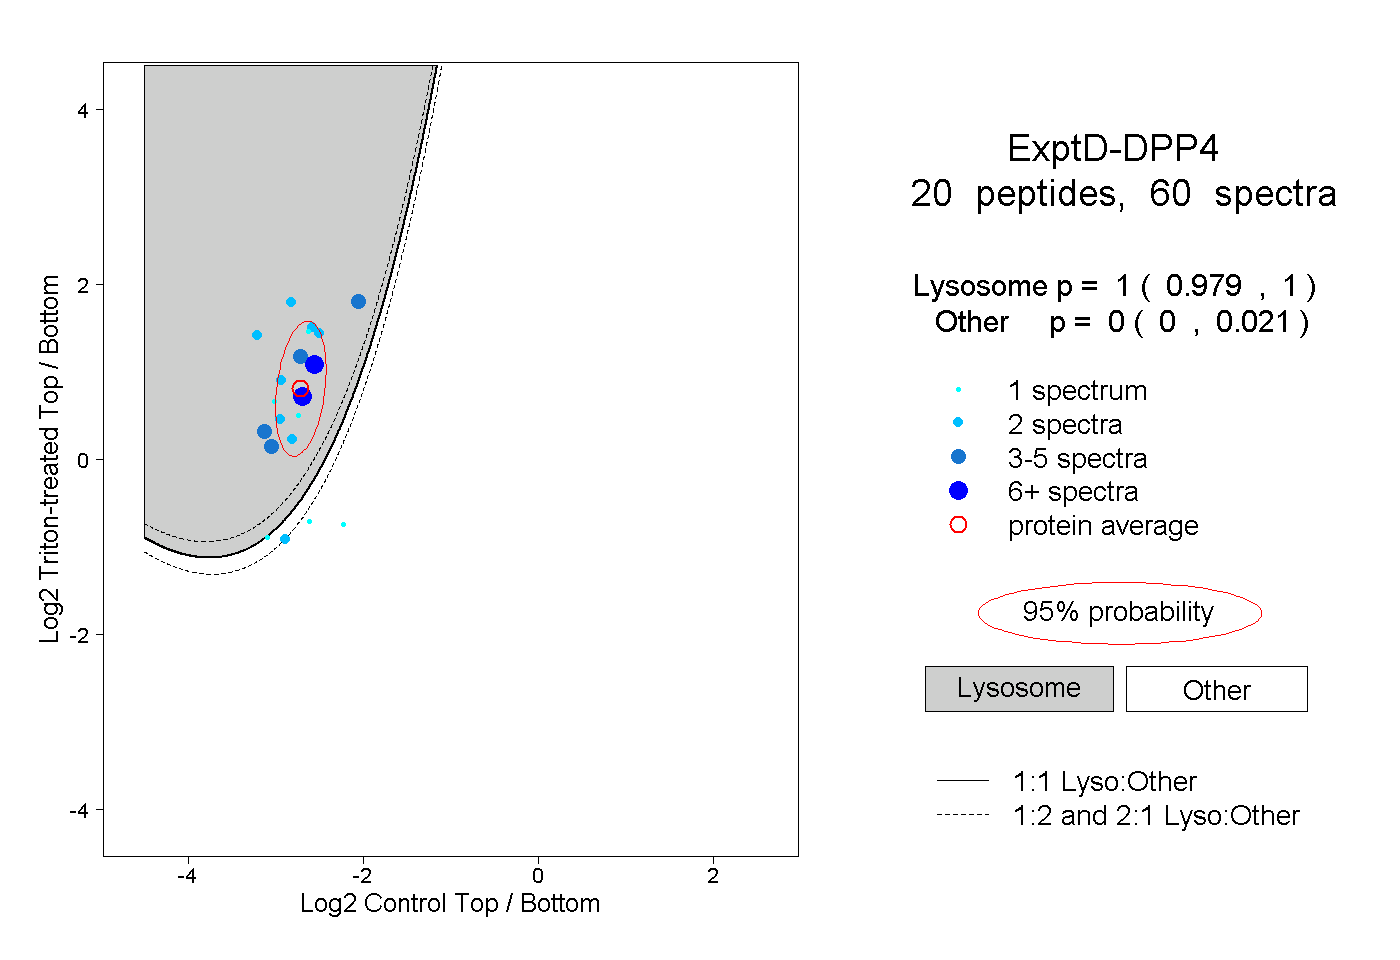
0.979 | 1.000
0.000 | 0.021