 6
6peptides
spectra
0.000 | 0.000
0.000 | 0.000
0.000 | 0.000
0.502 | 0.562
0.000 | 0.004
0.000 | 0.000
0.000 | 0.061
0.398 | 0.472
1peptide
spectrum
NA | NA
NA | NA
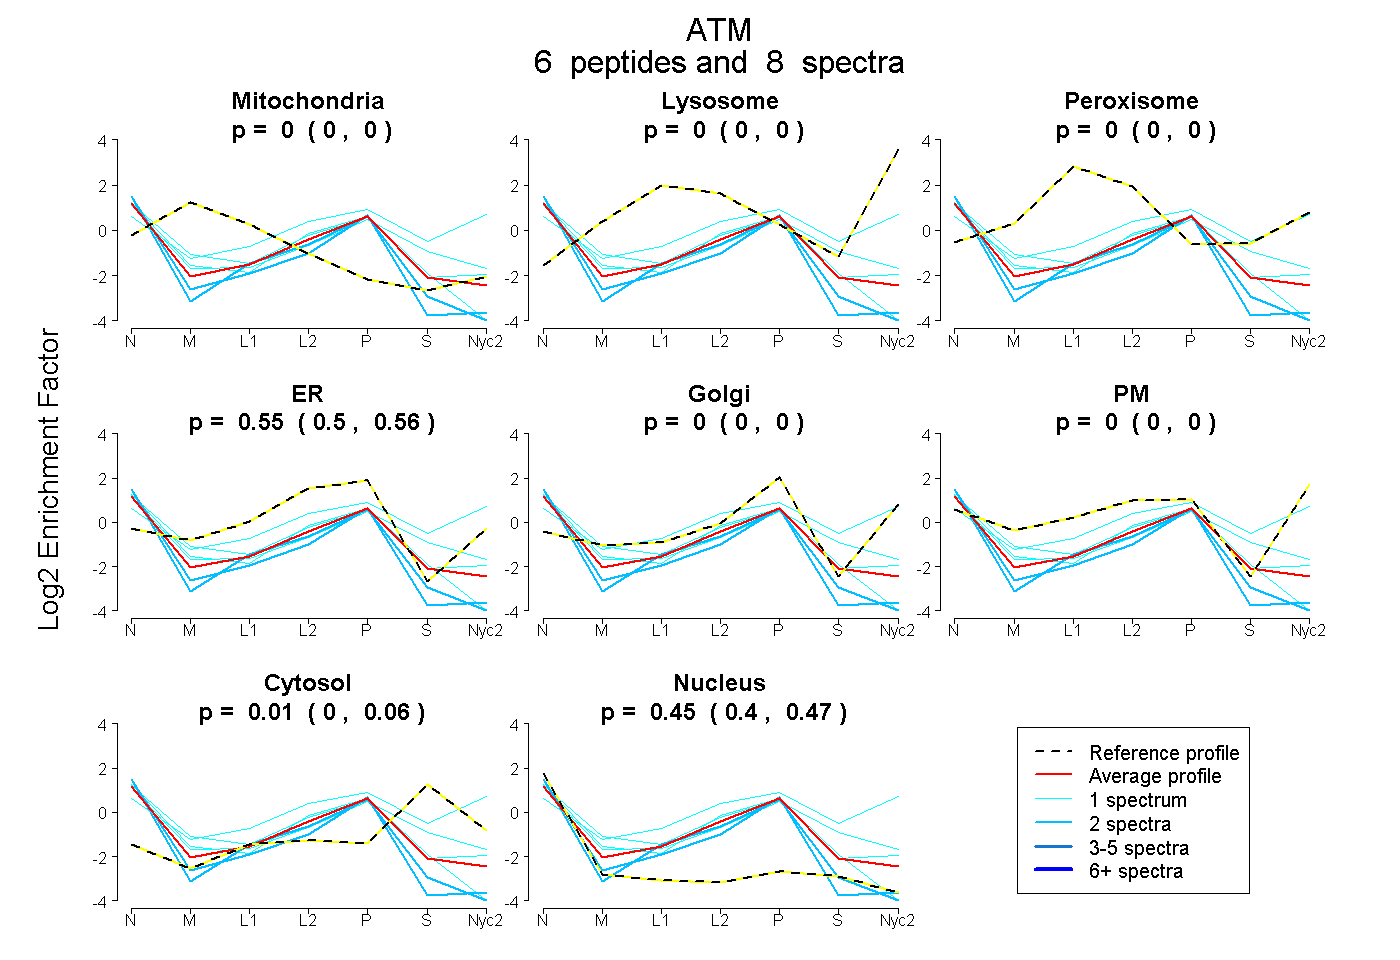
| Plot | Mito | Lyso | Perox | ER | Golgi | PM | Cytosol | Nucleus | |||||
| Expt A |
6 peptides |
8 spectra |
|
0.000 0.000 | 0.000 |
0.000 0.000 | 0.000 |
0.000 0.000 | 0.000 |
0.546 0.502 | 0.562 |
0.000 0.000 | 0.004 |
0.000 0.000 | 0.000 |
0.007 0.000 | 0.061 |
0.447 0.398 | 0.472 |
||
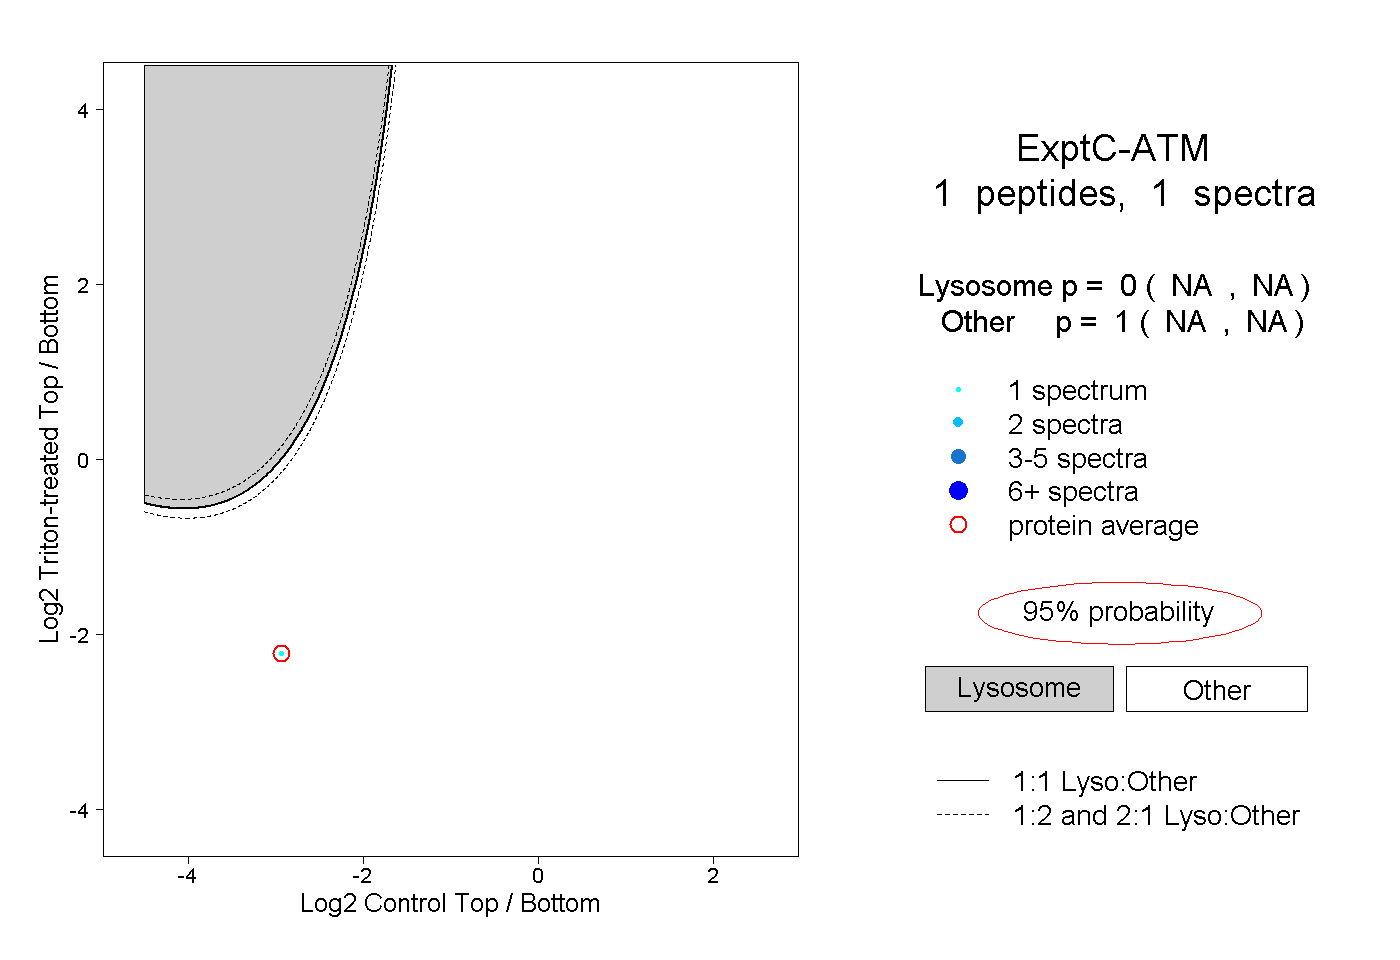
| Plot | Lyso | Other | |||||||||||
| Expt C |
1 peptide |
1 spectrum |
|
0.000 NA | NA |
1.000 NA | NA |