 6
6peptides
spectra
0.000 | 0.000
0.426 | 0.481
0.000 | 0.000
0.000 | 0.000
0.270 | 0.327
0.194 | 0.284
0.000 | 0.000
0.000 | 0.000
| Plot | Mito | Lyso | Perox | ER | Golgi | PM | Cytosol | Nucleus | |||||
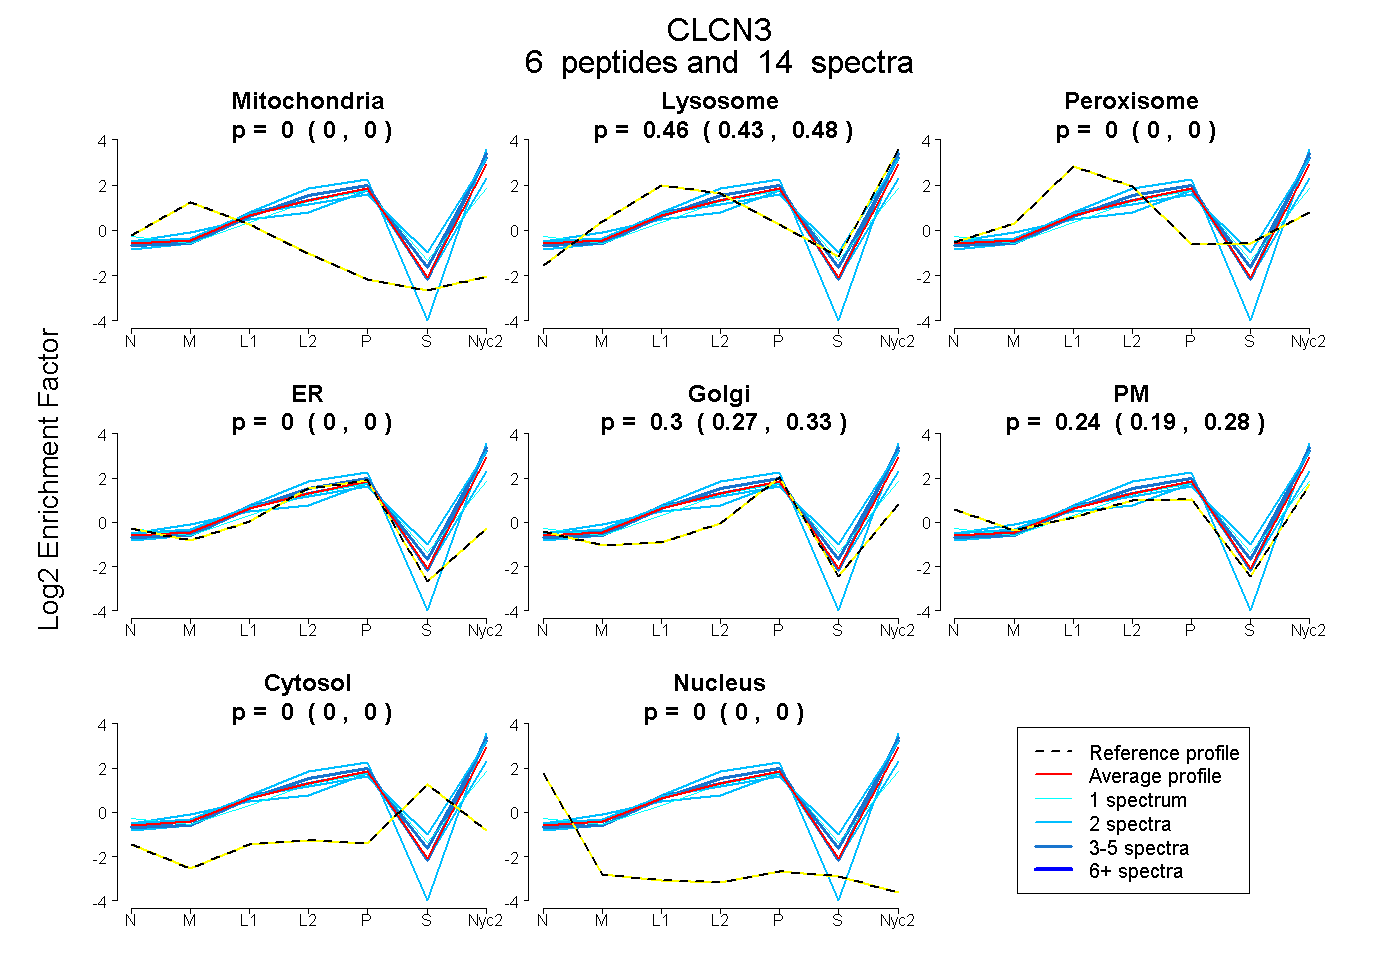
| Expt A |
6 peptides |
14 spectra |
|
0.000 0.000 | 0.000 |
0.457 0.426 | 0.481 |
0.000 0.000 | 0.000 |
0.000 0.000 | 0.000 |
0.300 0.270 | 0.327 |
0.242 0.194 | 0.284 |
0.000 0.000 | 0.000 |
0.000 0.000 | 0.000 |
| 4 spectra, TILSGFIIR | 0.000 | 0.506 | 0.000 | 0.000 | 0.275 | 0.219 | 0.000 | 0.000 | ||
| 2 spectra, DLTIAIESAR | 0.000 | 0.365 | 0.000 | 0.000 | 0.395 | 0.240 | 0.000 | 0.000 | ||
| 2 spectra, LLGIITK | 0.000 | 0.372 | 0.000 | 0.010 | 0.133 | 0.485 | 0.000 | 0.000 | ||
| 3 spectra, SINPFGNSR | 0.000 | 0.560 | 0.000 | 0.000 | 0.297 | 0.142 | 0.000 | 0.000 | ||
| 2 spectra, WVGDAFGR | 0.000 | 0.597 | 0.000 | 0.000 | 0.288 | 0.114 | 0.000 | 0.000 | ||
| 1 spectrum, VCFAQHTPSLPAESPRPLK | 0.000 | 0.330 | 0.000 | 0.167 | 0.303 | 0.192 | 0.008 | 0.000 |
| Plot | Lyso | Other | |||||||||||
| Expt C |
8 peptides |
24 spectra |
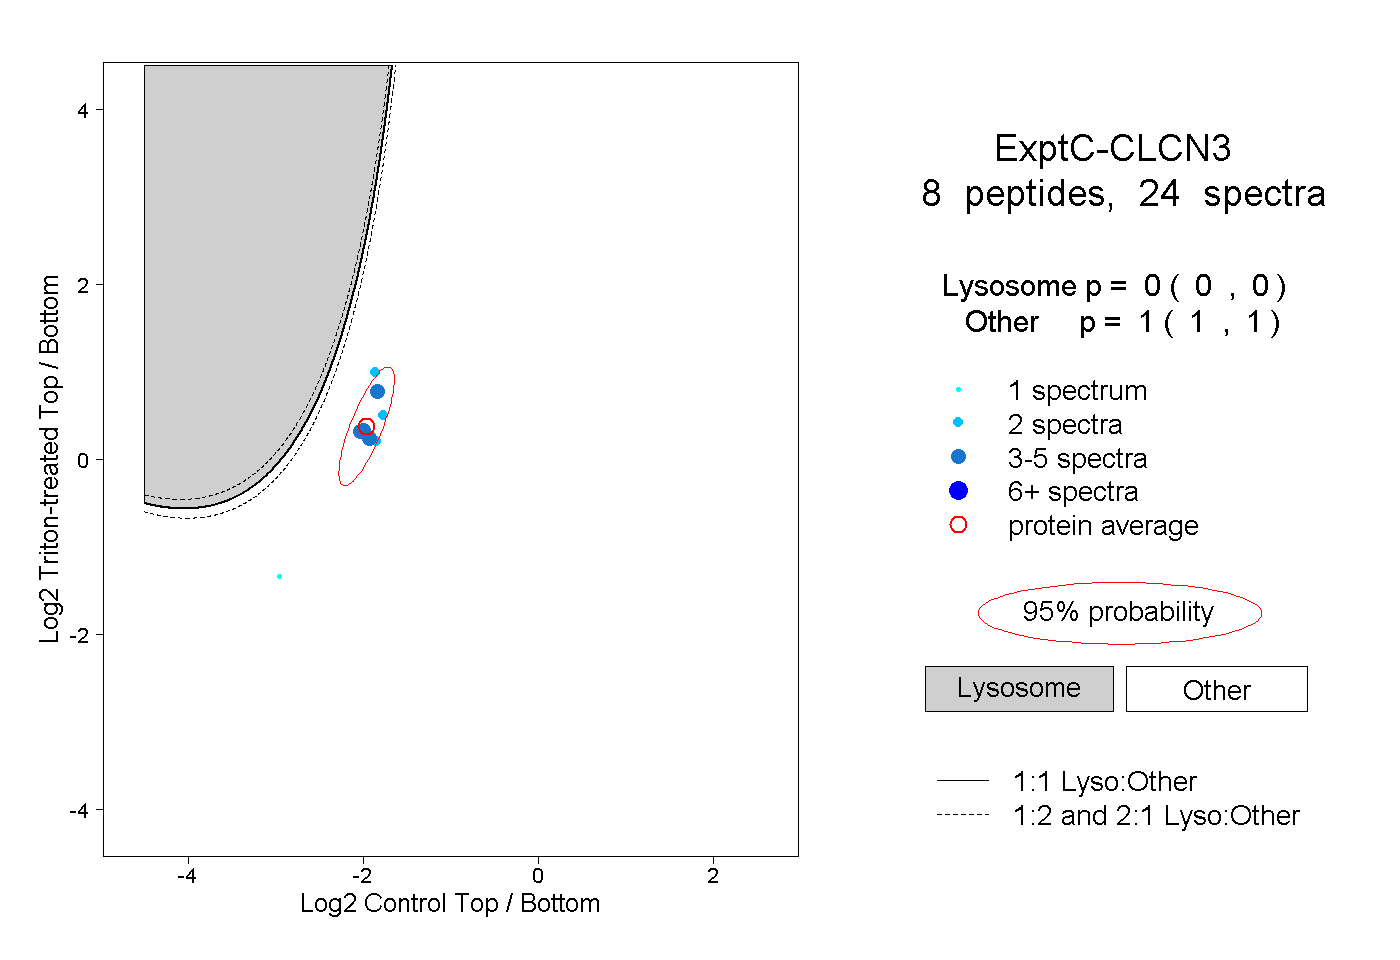 |
0.000 0.000 | 0.000 |
1.000 1.000 | 1.000 |