 4
4peptides
spectra
0.000 | 0.000
0.083 | 0.251
0.000 | 0.000
0.000 | 0.132
0.000 | 0.278
0.180 | 0.463
0.263 | 0.398
0.000 | 0.000
2peptides
spectra
NA | NA
NA | NA
NA | NA
NA | NA
NA | NA
NA | NA
NA | NA
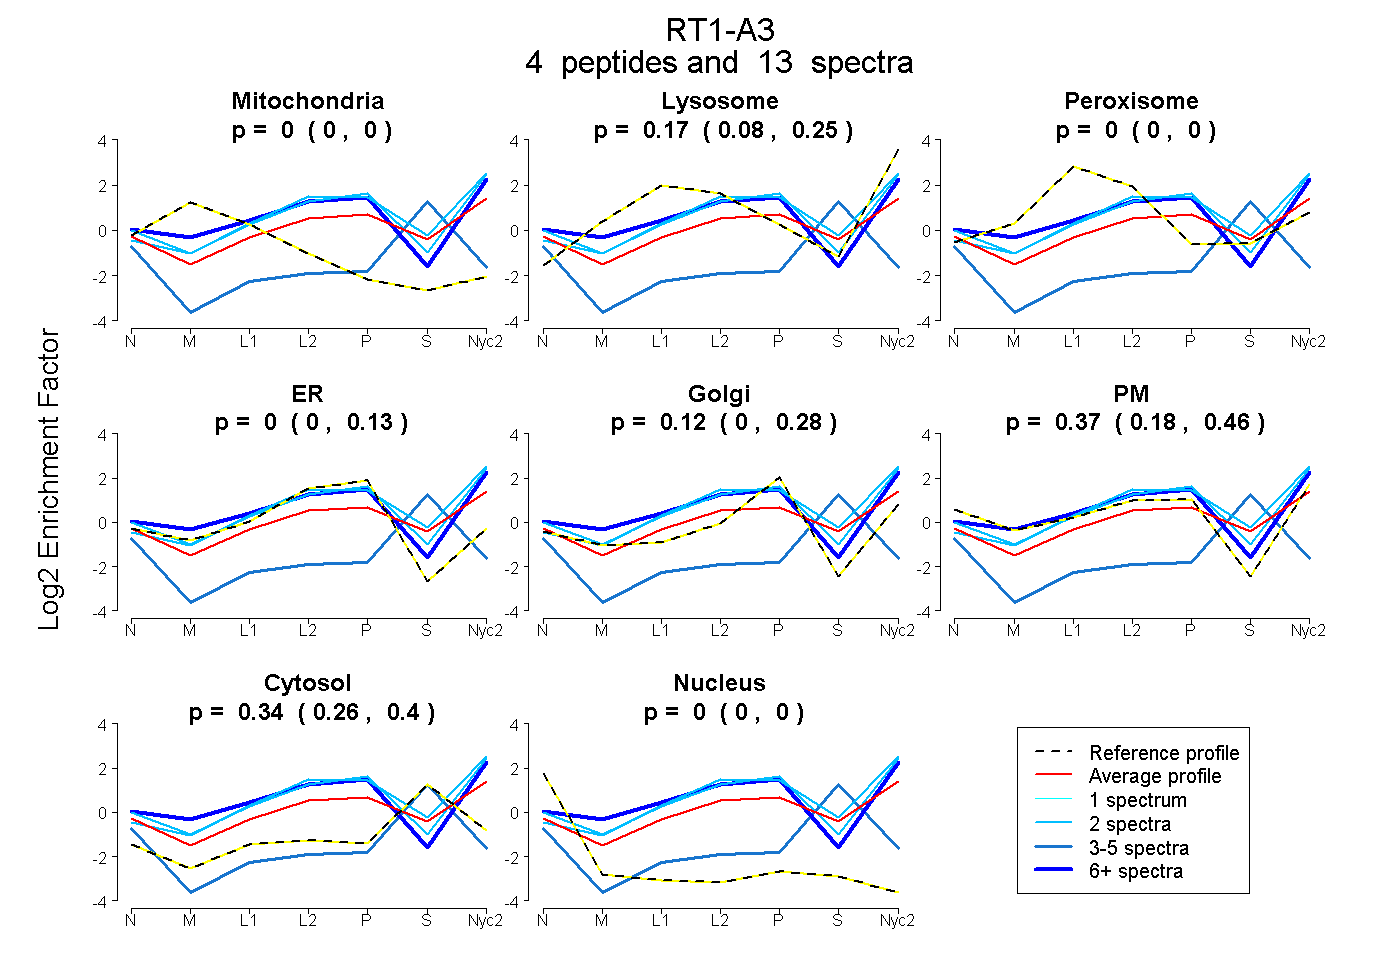
| Plot | Mito | Lyso | Perox | ER | Golgi | PM | Cytosol | Nucleus | |||||
| Expt A |
4 peptides |
13 spectra |
|
0.000 0.000 | 0.000 |
0.172 0.083 | 0.251 |
0.000 0.000 | 0.000 |
0.000 0.000 | 0.132 |
0.115 0.000 | 0.278 |
0.374 0.180 | 0.463 |
0.339 0.263 | 0.398 |
0.000 0.000 | 0.000 |
||
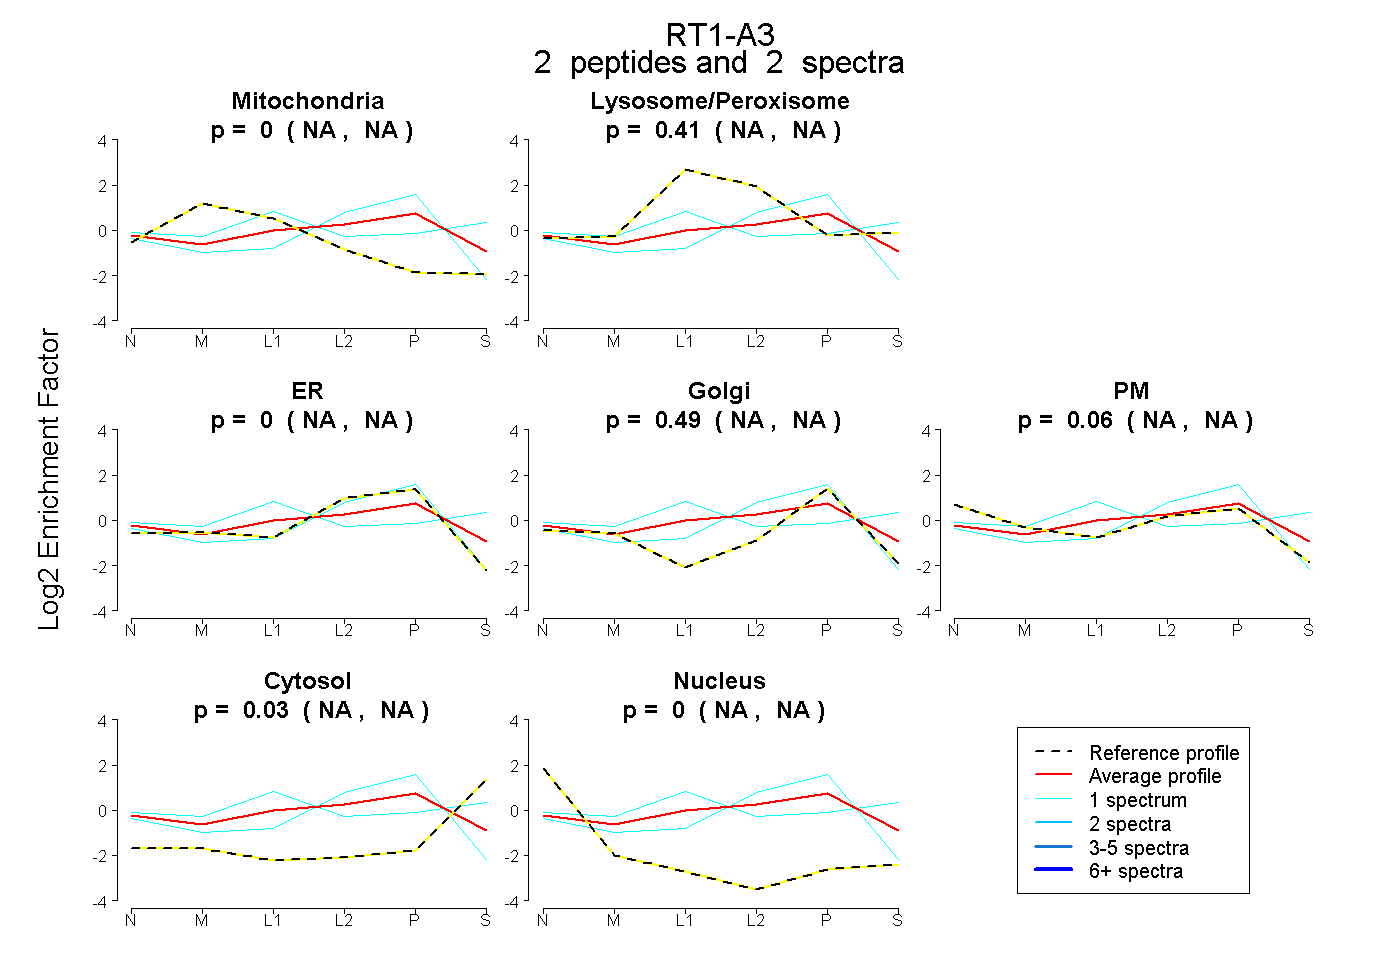
| Plot | Mito | Lyso or Perox | ER | Golgi | PM | Cytosol | Nucleus | ||||||
| Expt B |
2 peptides |
2 spectra |
|
0.000 NA | NA |
0.411 NA | NA |
0.000 NA | NA |
0.491 NA | NA |
0.064 NA | NA |
0.034 NA | NA |
0.000 NA | NA |
| 1 spectrum, YDSDAK | 0.024 | 0.496 | 0.000 | 0.027 | 0.171 | 0.270 | 0.012 | |||
| 1 spectrum, DYIVLNEDLK | 0.000 | 0.000 | 0.912 | 0.077 | 0.000 | 0.000 | 0.011 |
| Plot | Lyso | Other | |||||||||||
| Expt C |
5 peptides |
16 spectra |
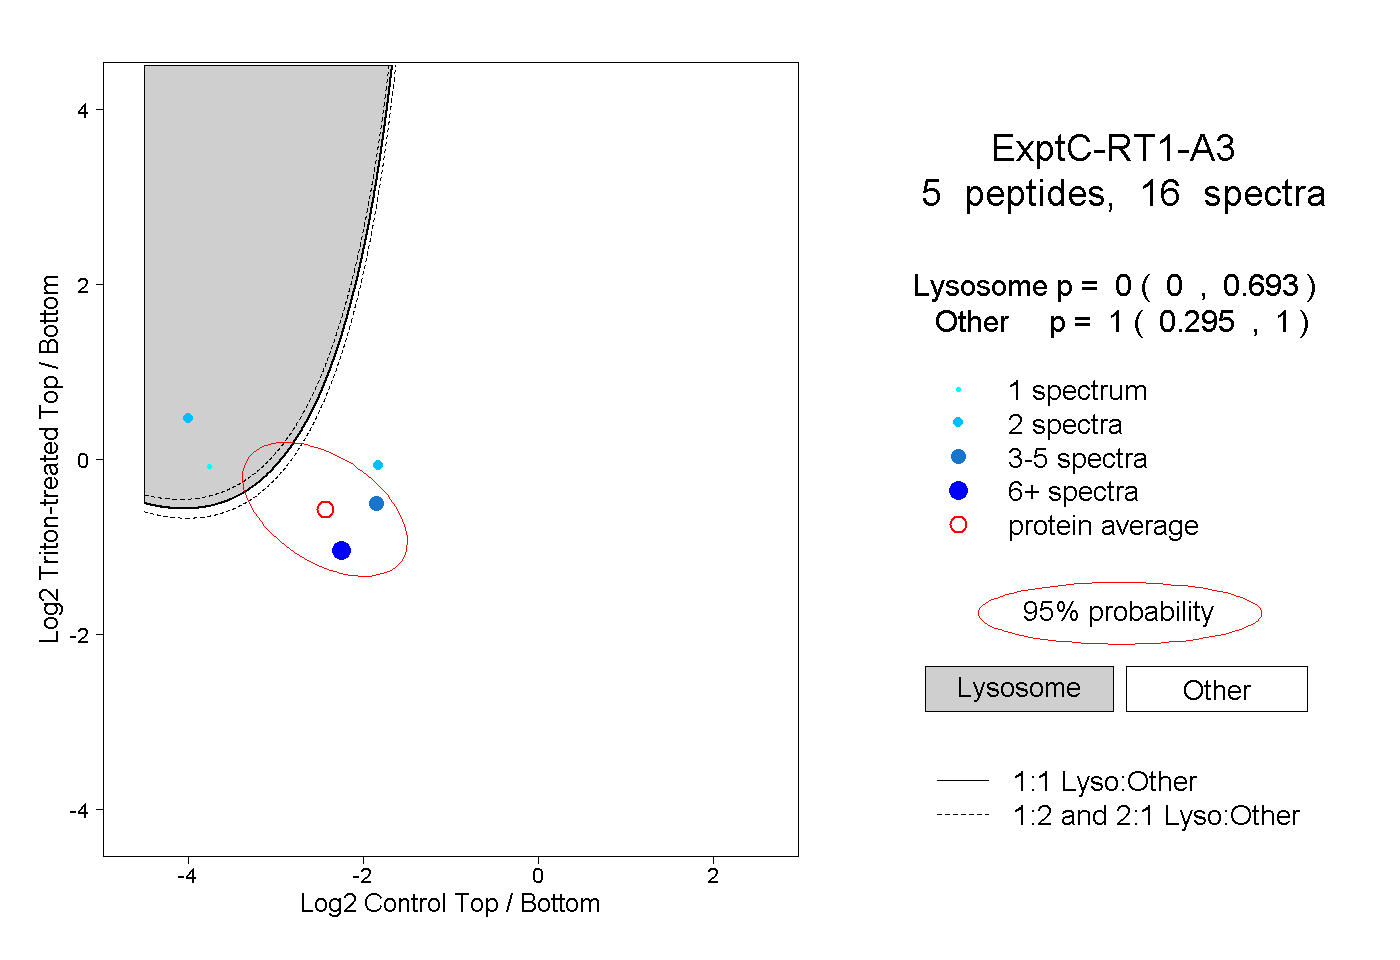 |
0.000 0.000 | 0.693 |
1.000 0.295 | 1.000 |
||||||||
| Plot | Lyso | Other | |||||||||||
| Expt D |
2 peptides |
2 spectra |
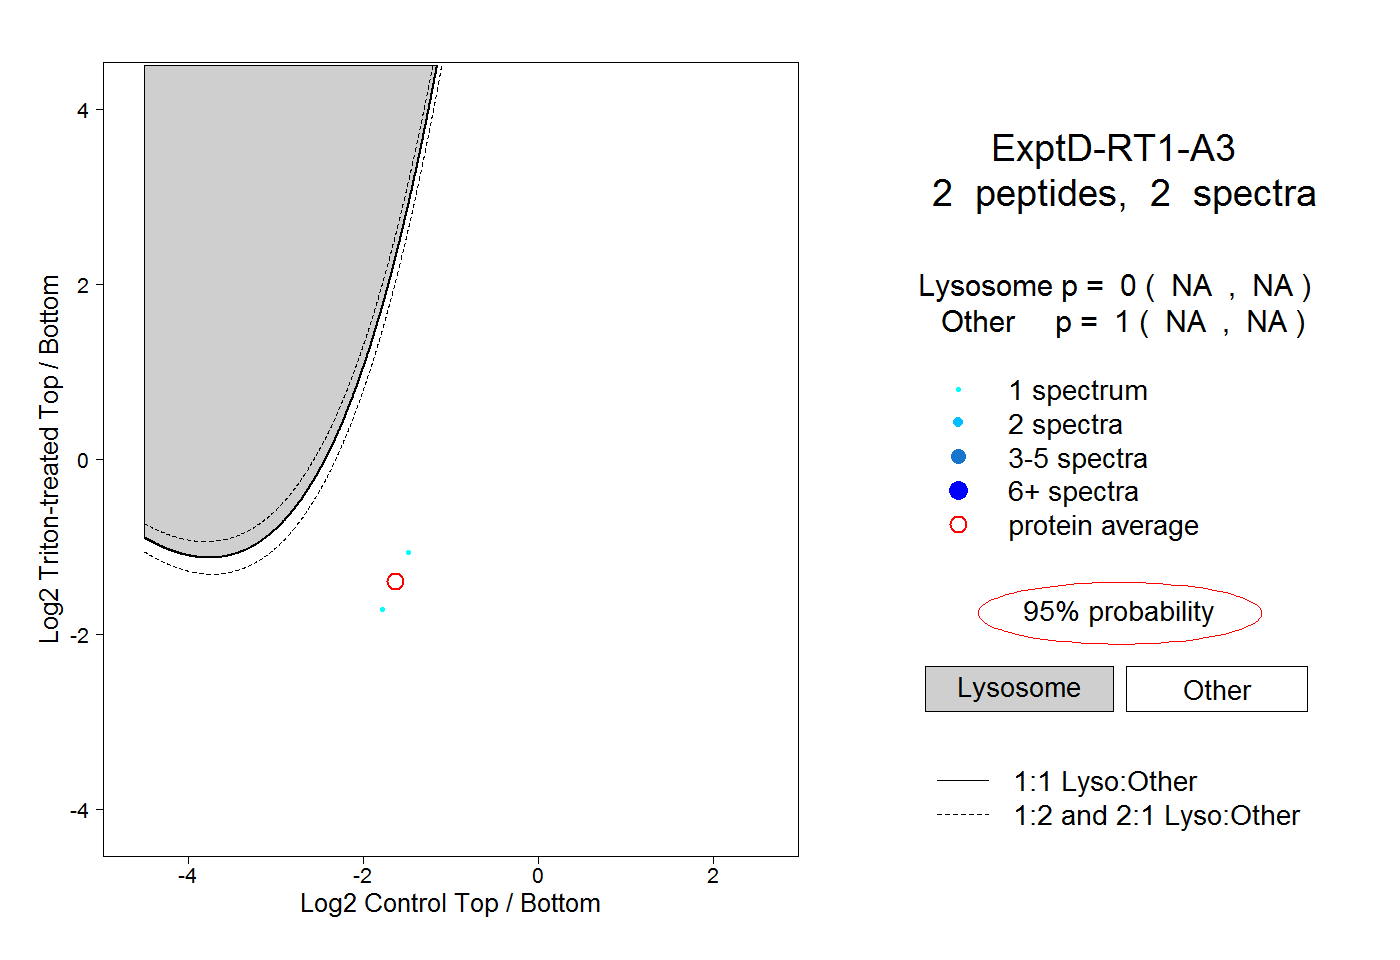 |
0.000 NA | NA |
1.000 NA | NA |