 12
12peptides
spectra
0.000 | 0.000
0.121 | 0.144
0.000 | 0.000
0.000 | 0.010
0.033 | 0.058
0.000 | 0.000
0.809 | 0.822
0.000 | 0.000
2peptides
spectra
NA | NA
NA | NA
NA | NA
NA | NA
NA | NA
NA | NA
NA | NA
| Plot | Mito | Lyso | Perox | ER | Golgi | PM | Cytosol | Nucleus | |||||
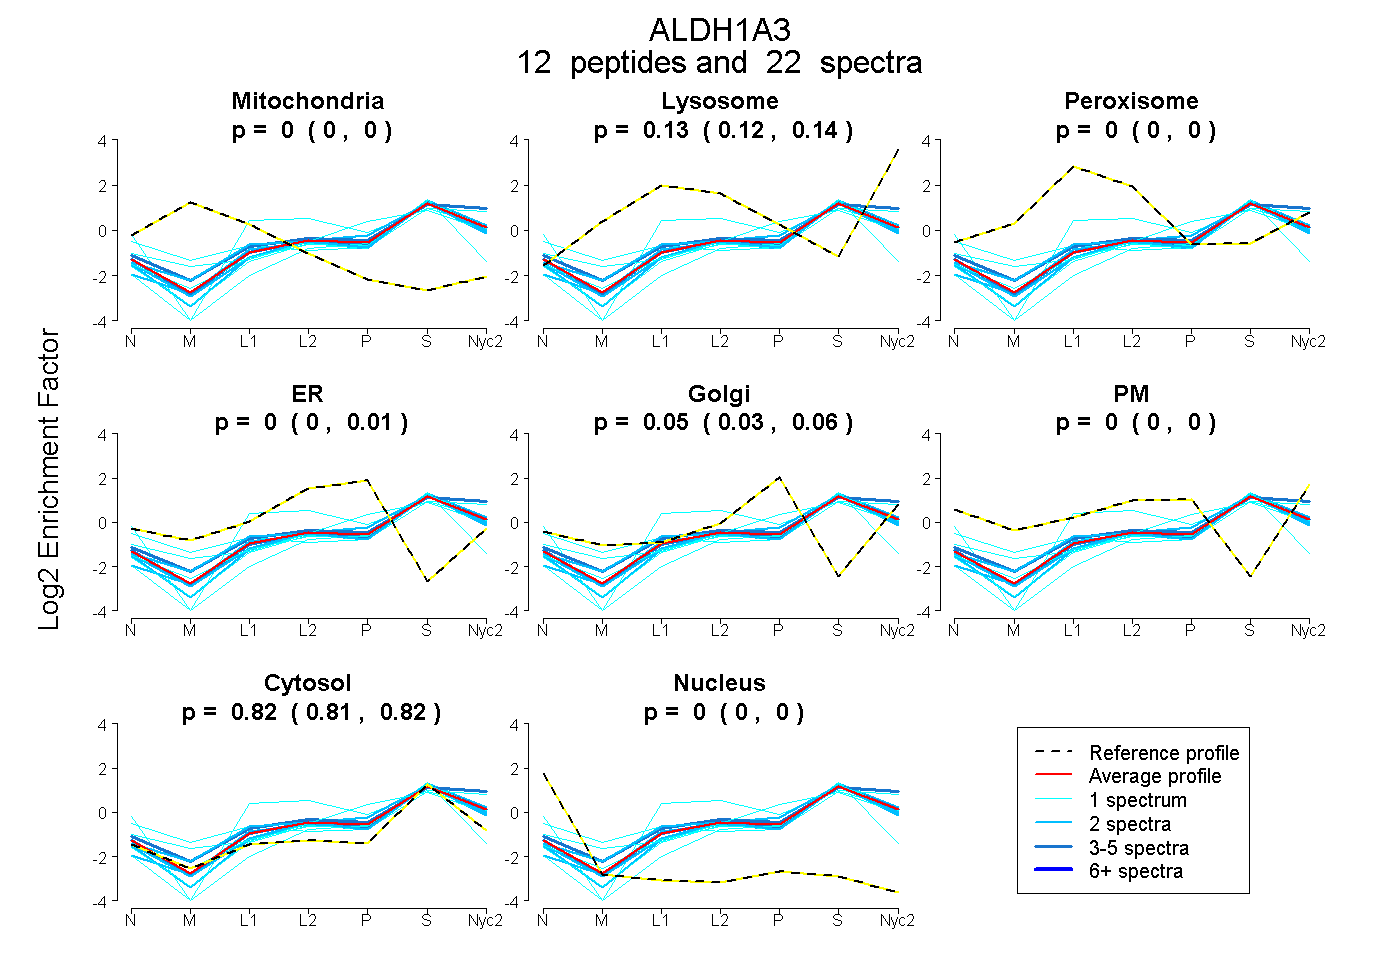
| Expt A |
12 peptides |
22 spectra |
|
0.000 0.000 | 0.000 |
0.134 0.121 | 0.144 |
0.000 0.000 | 0.000 |
0.000 0.000 | 0.010 |
0.050 0.033 | 0.058 |
0.000 0.000 | 0.000 |
0.816 0.809 | 0.822 |
0.000 0.000 | 0.000 |
||
| Plot | Mito | Lyso or Perox | ER | Golgi | PM | Cytosol | Nucleus | ||||||
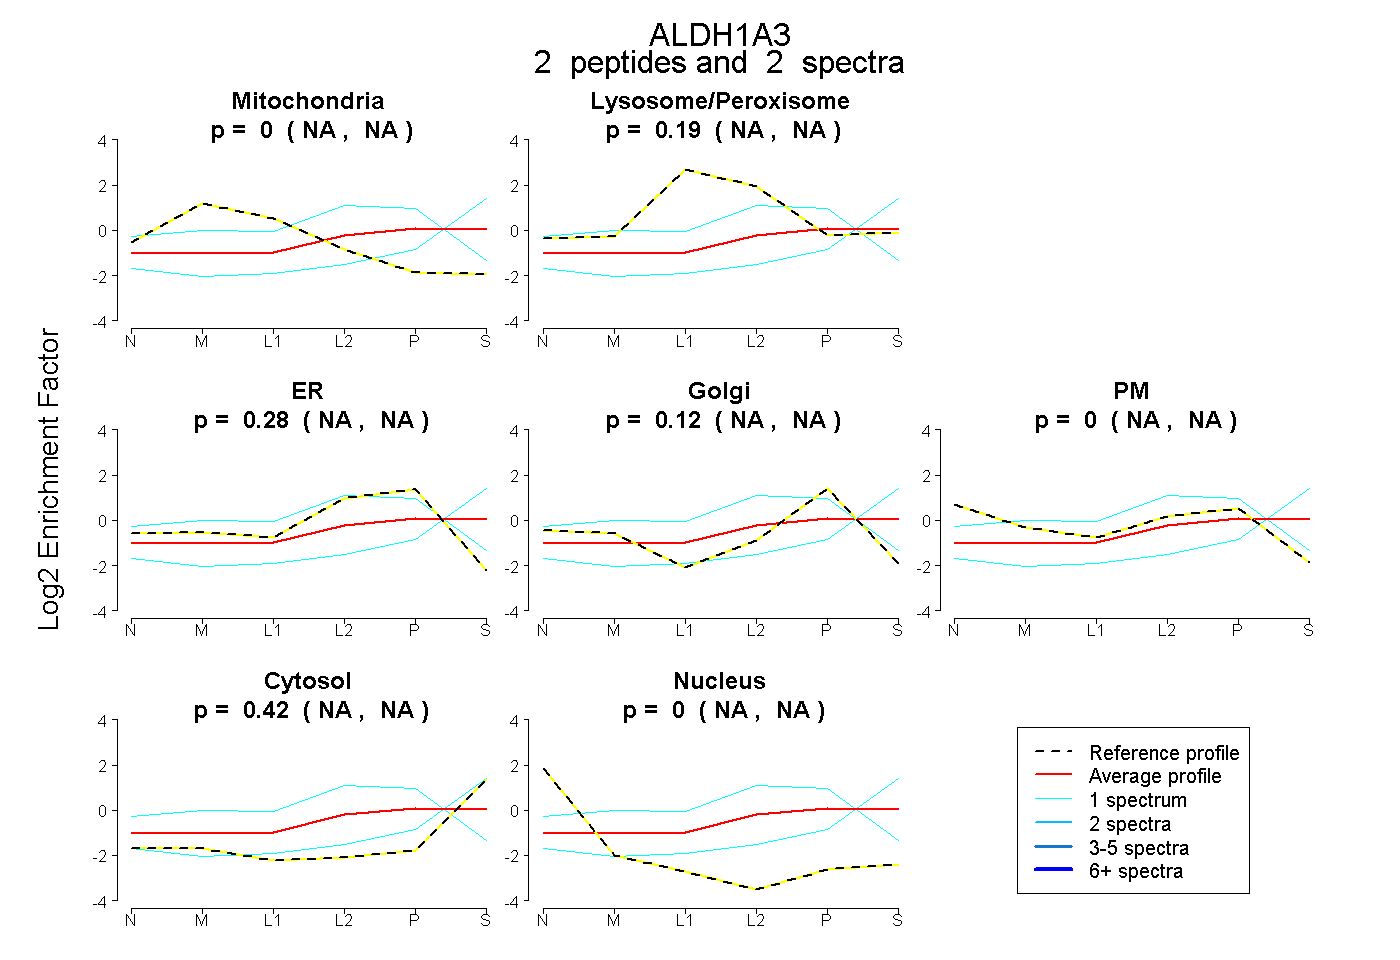
| Expt B |
2 peptides |
2 spectra |
|
0.000 NA | NA |
0.188 NA | NA |
0.275 NA | NA |
0.122 NA | NA |
0.000 NA | NA |
0.416 NA | NA |
0.000 NA | NA |
| 1 spectrum, GQLLHQLADLIER | 0.000 | 0.032 | 0.098 | 0.000 | 0.000 | 0.870 | 0.000 | |||
| 1 spectrum, ILELIESGK | 0.000 | 0.277 | 0.496 | 0.080 | 0.146 | 0.000 | 0.000 |
| Plot | Lyso | Other | |||||||||||
| Expt C |
7 peptides |
15 spectra |
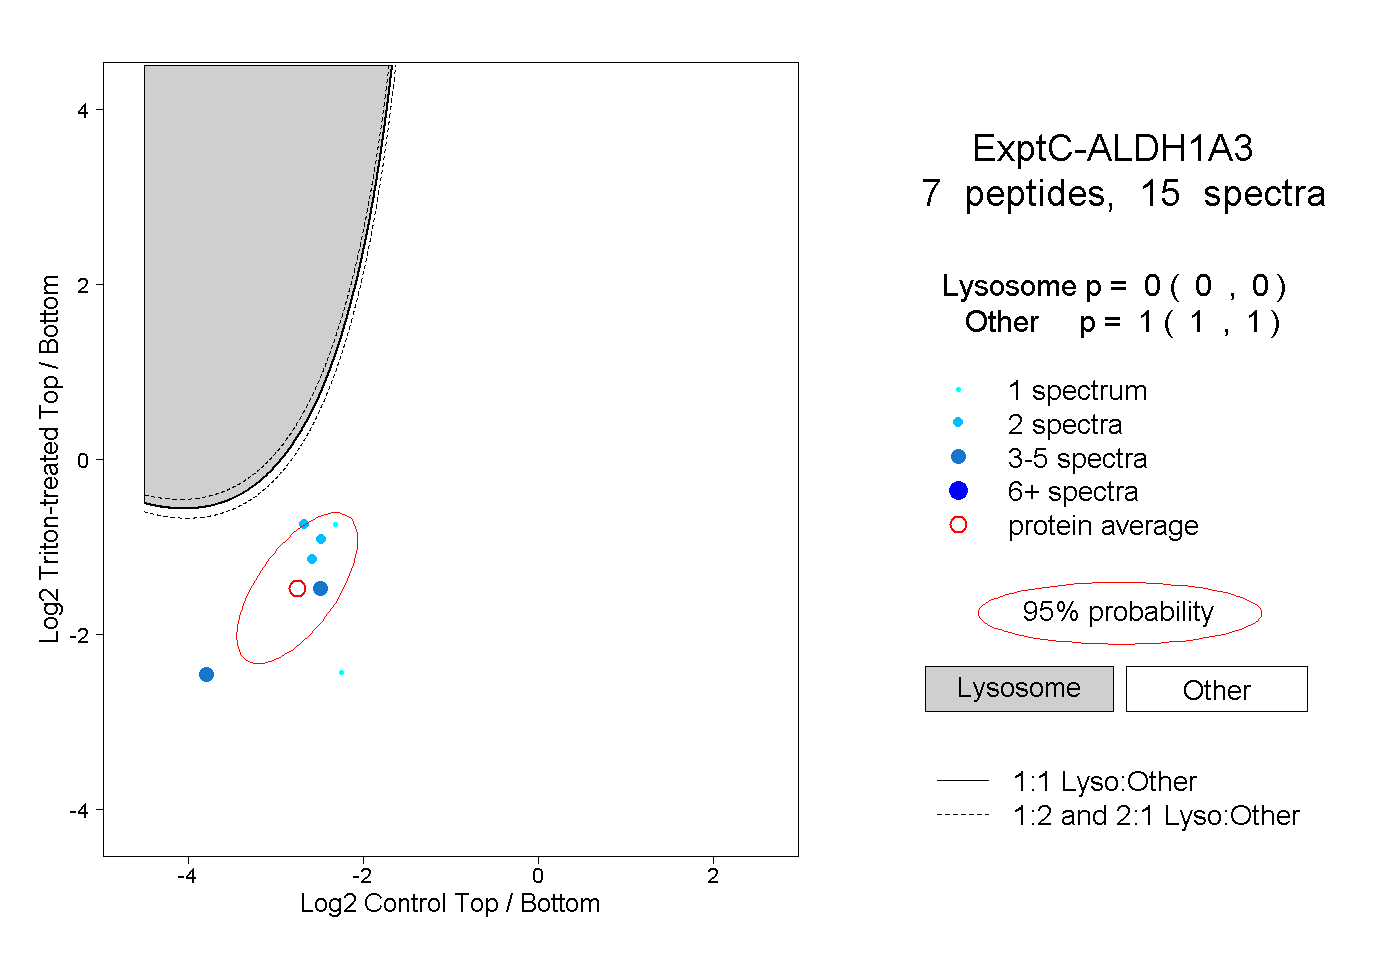 |
0.000 0.000 | 0.000 |
1.000 1.000 | 1.000 |