 12
12peptides
spectra
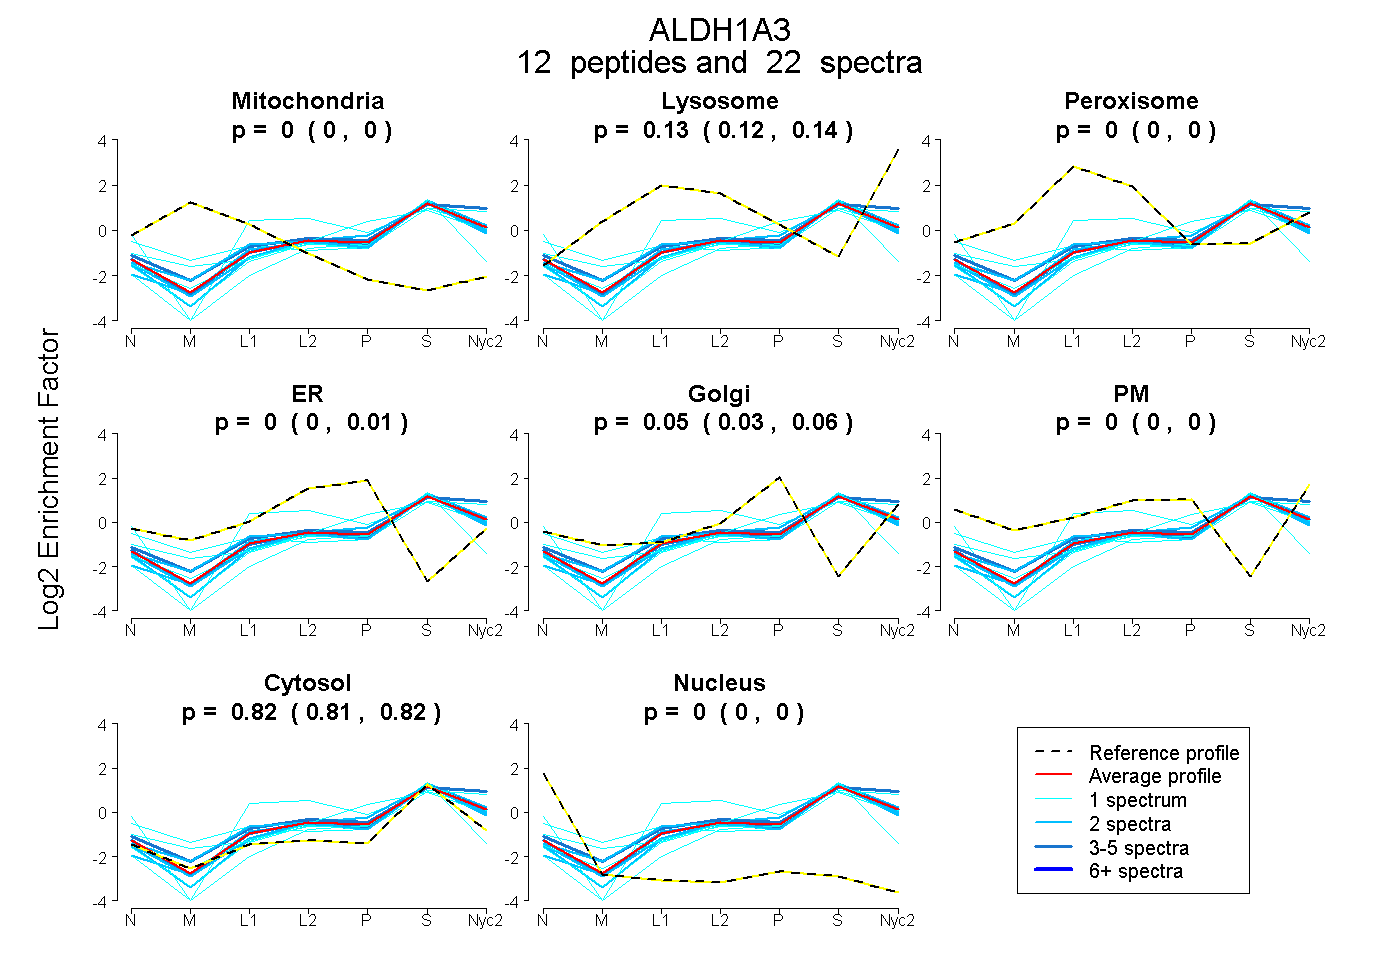
0.000 | 0.000
0.121 | 0.144
0.000 | 0.000
0.000 | 0.010
0.033 | 0.058
0.000 | 0.000
0.809 | 0.822
0.000 | 0.000
2peptides
spectra
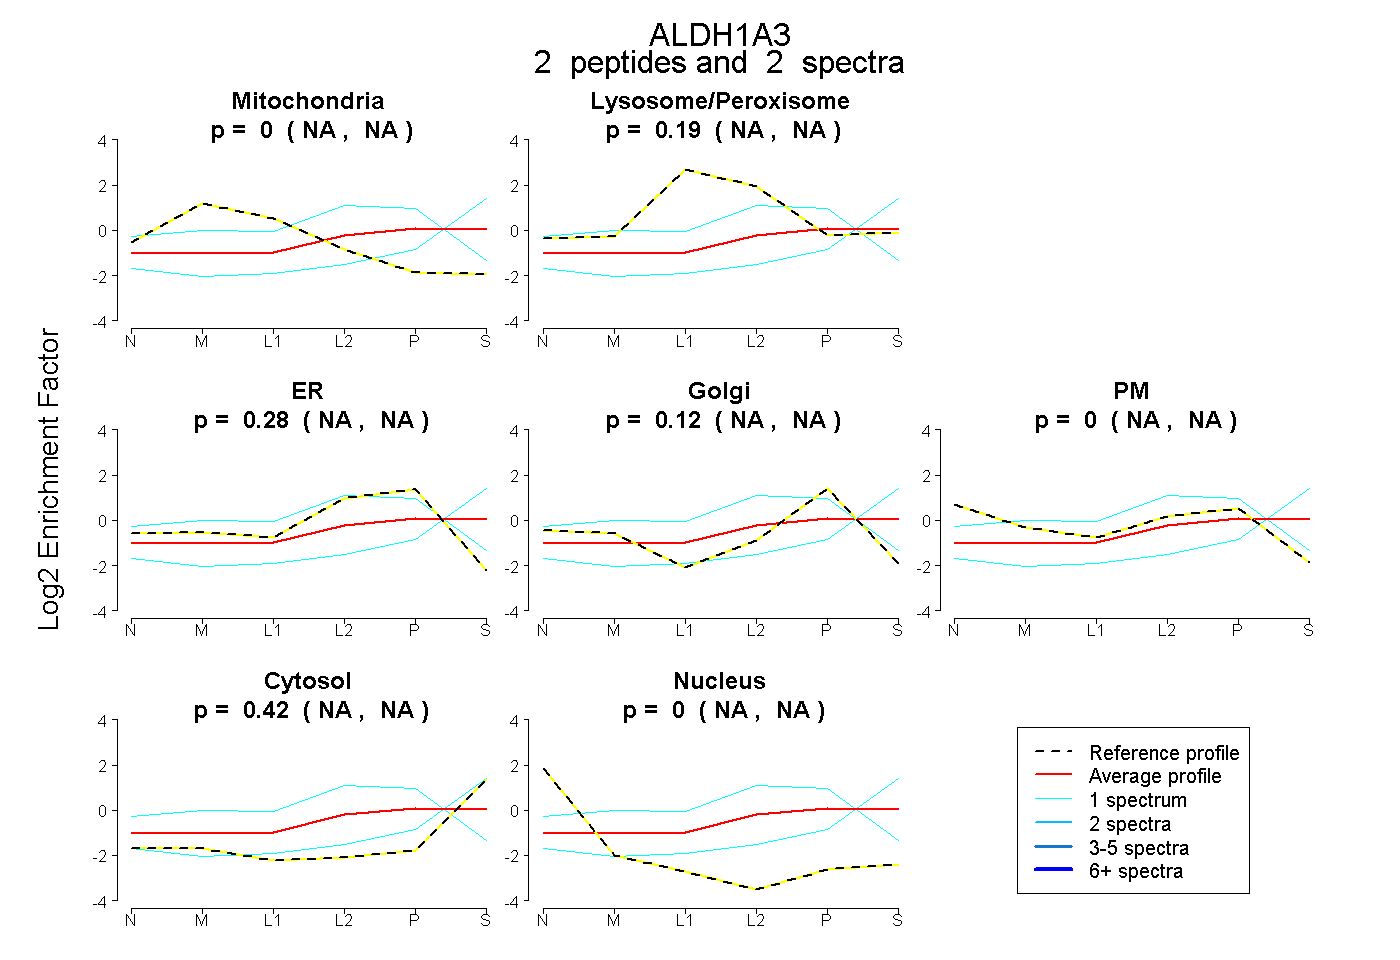
NA | NA
NA | NA
NA | NA
NA | NA
NA | NA
NA | NA
NA | NA
7peptides
spectra
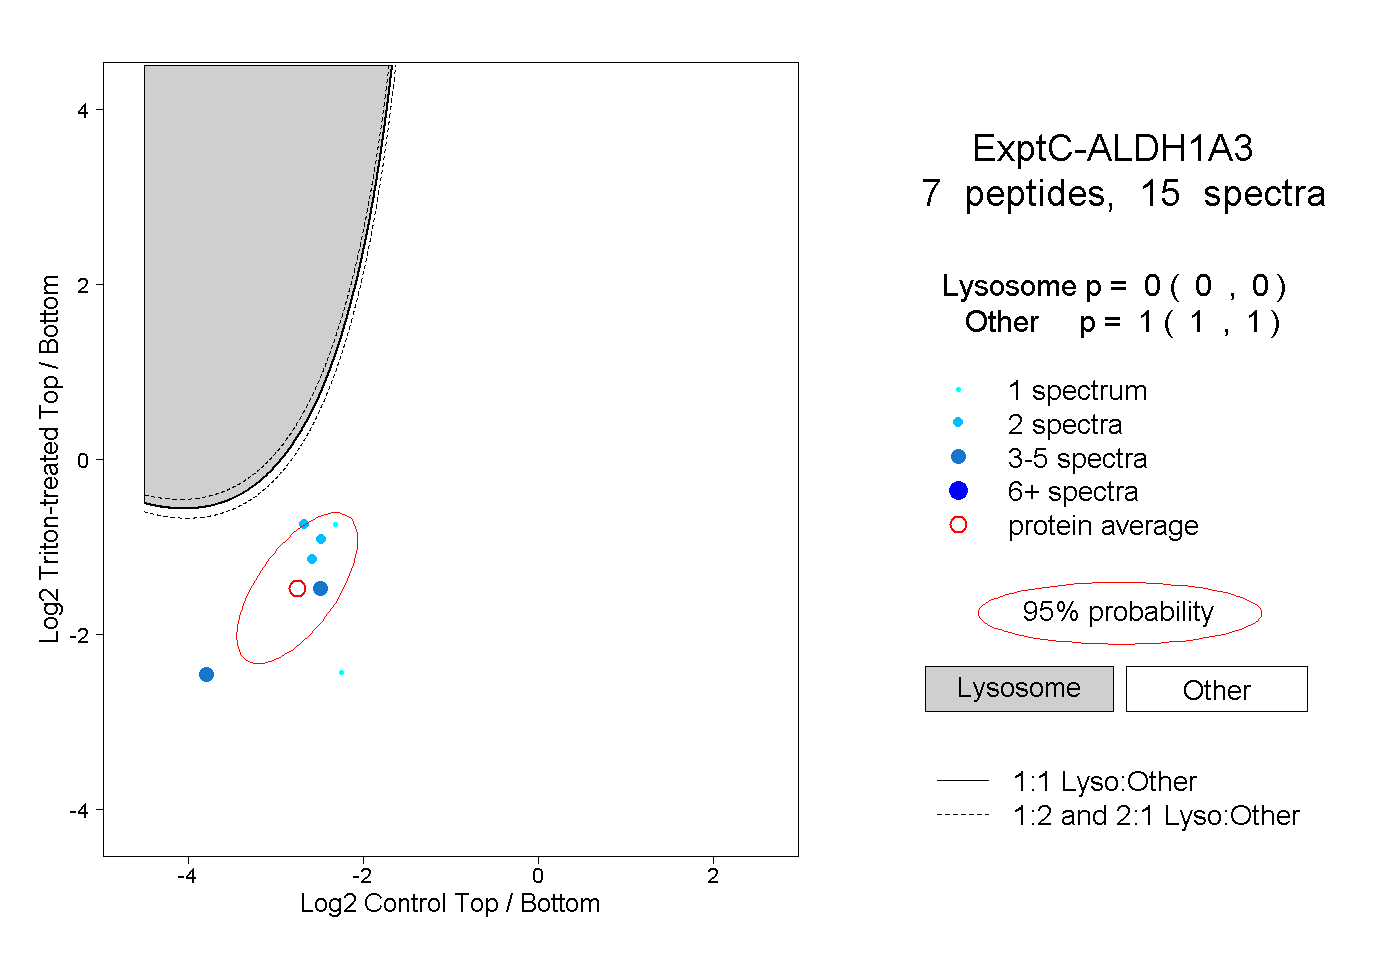
0.000 | 0.000
1.000 | 1.000