 2
2peptides
spectra
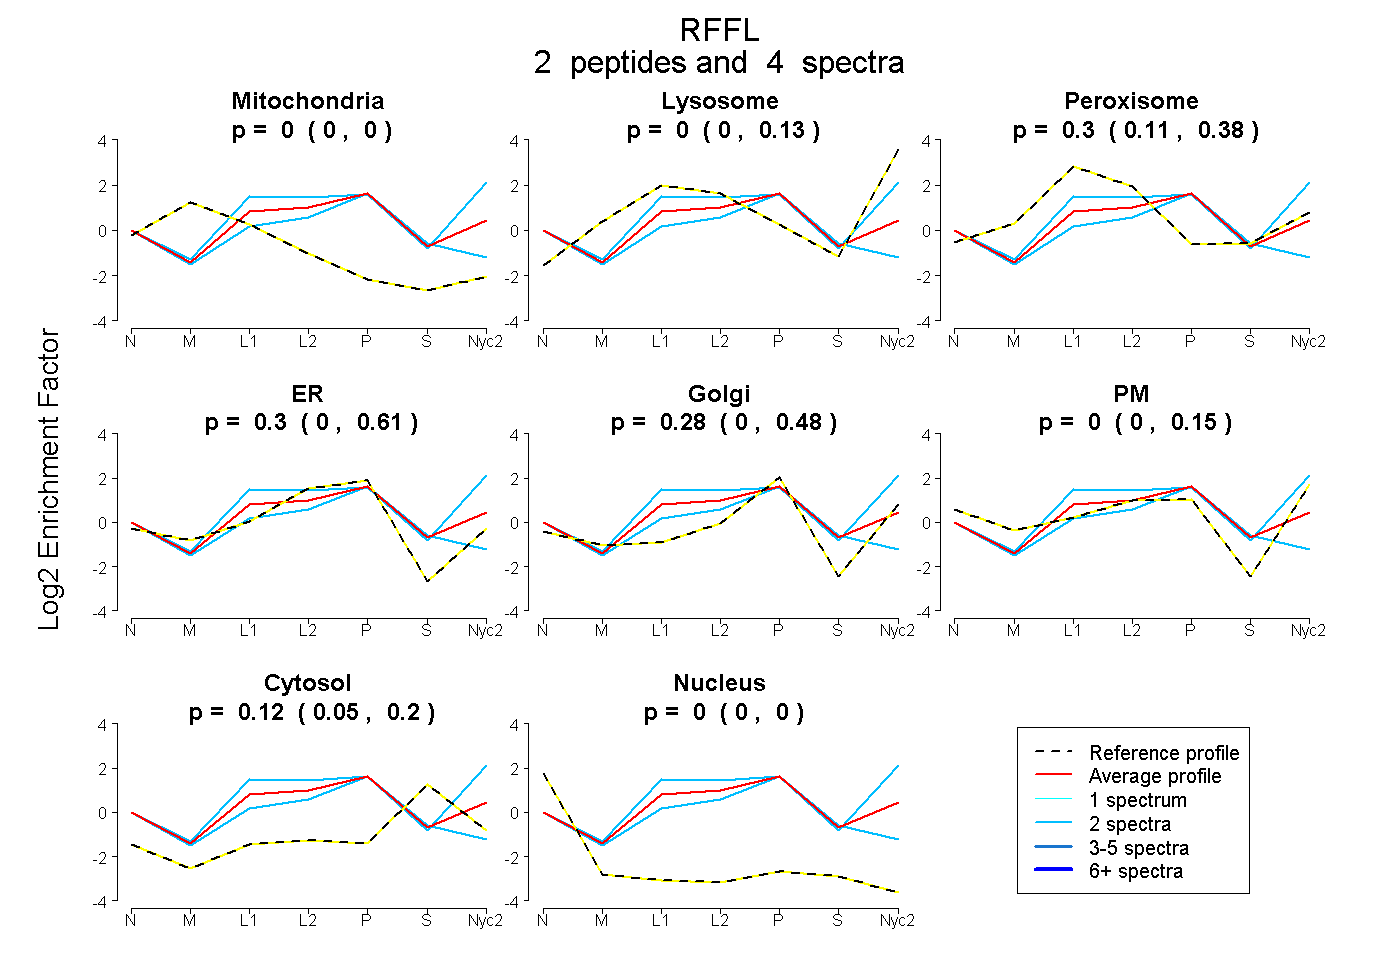
0.000 | 0.000
0.000 | 0.127
0.109 | 0.380
0.000 | 0.611
0.000 | 0.480
0.000 | 0.152
0.053 | 0.199
0.000 | 0.000
| Plot | Mito | Lyso | Perox | ER | Golgi | PM | Cytosol | Nucleus | |||||
| Expt A |
2 peptides |
4 spectra |
|
0.000 0.000 | 0.000 |
0.000 0.000 | 0.127 |
0.302 0.109 | 0.380 |
0.298 0.000 | 0.611 |
0.283 0.000 | 0.480 |
0.000 0.000 | 0.152 |
0.117 0.053 | 0.199 |
0.000 0.000 | 0.000 |
| 2 spectra, LCLLCLR | 0.000 | 0.000 | 0.009 | 0.676 | 0.000 | 0.000 | 0.315 | 0.000 | ||
| 2 spectra, AVHVFR | 0.000 | 0.353 | 0.117 | 0.137 | 0.083 | 0.271 | 0.039 | 0.000 |
| Plot | Lyso | Other | |||||||||||
| Expt C |
5 peptides |
15 spectra |
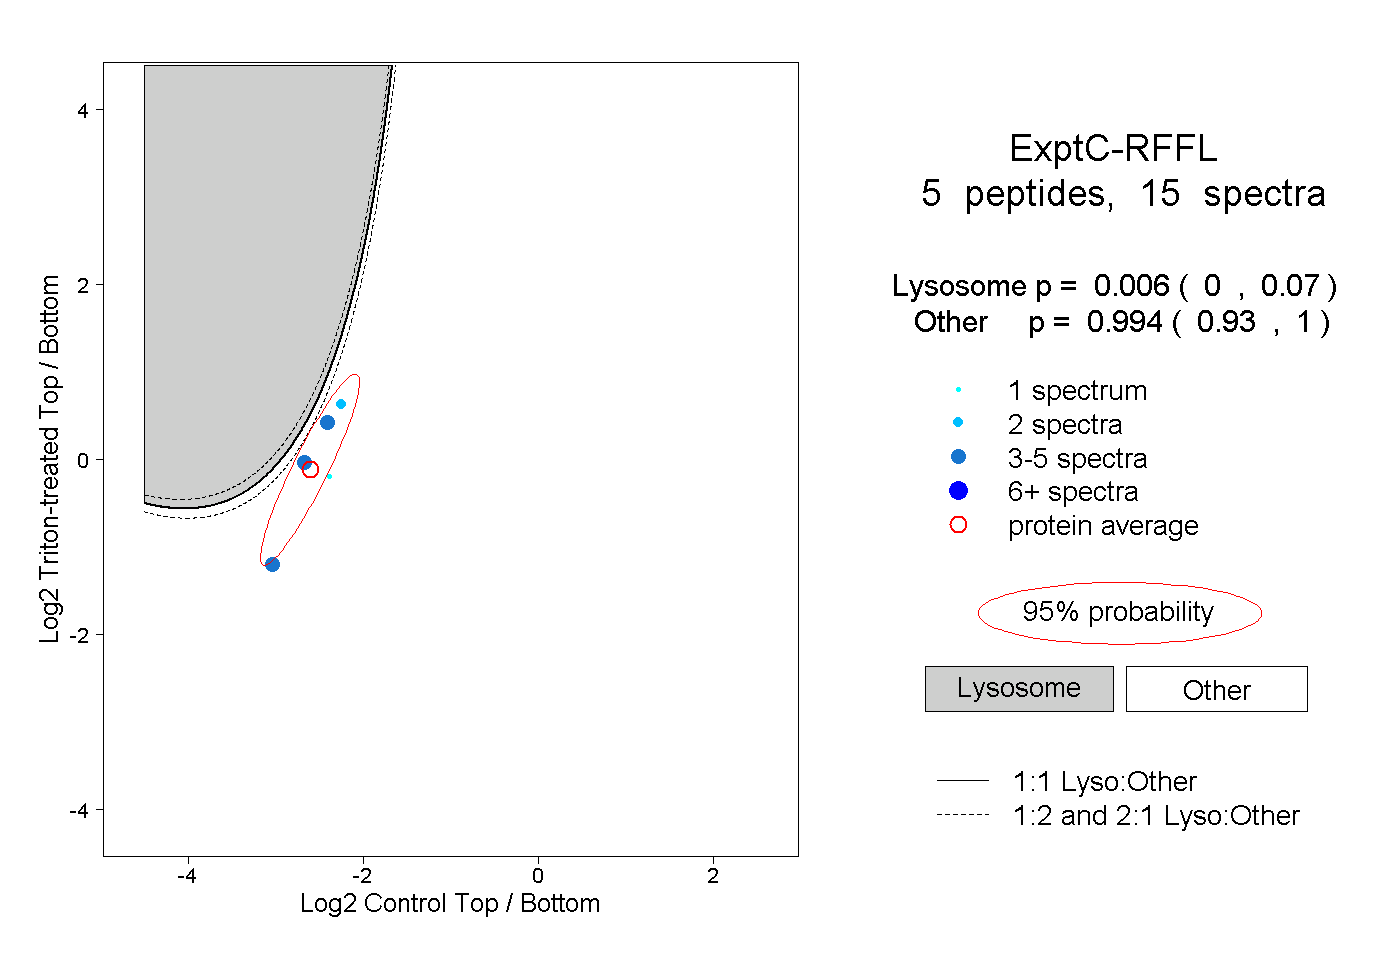 |
0.006 0.000 | 0.070 |
0.994 0.930 | 1.000 |