 10
10peptides
spectra
0.000 | 0.000
0.000 | 0.000
0.000 | 0.000
0.864 | 0.888
0.104 | 0.129
0.000 | 0.014
0.000 | 0.000
0.000 | 0.003
| Plot | Mito | Lyso | Perox | ER | Golgi | PM | Cytosol | Nucleus | |||||
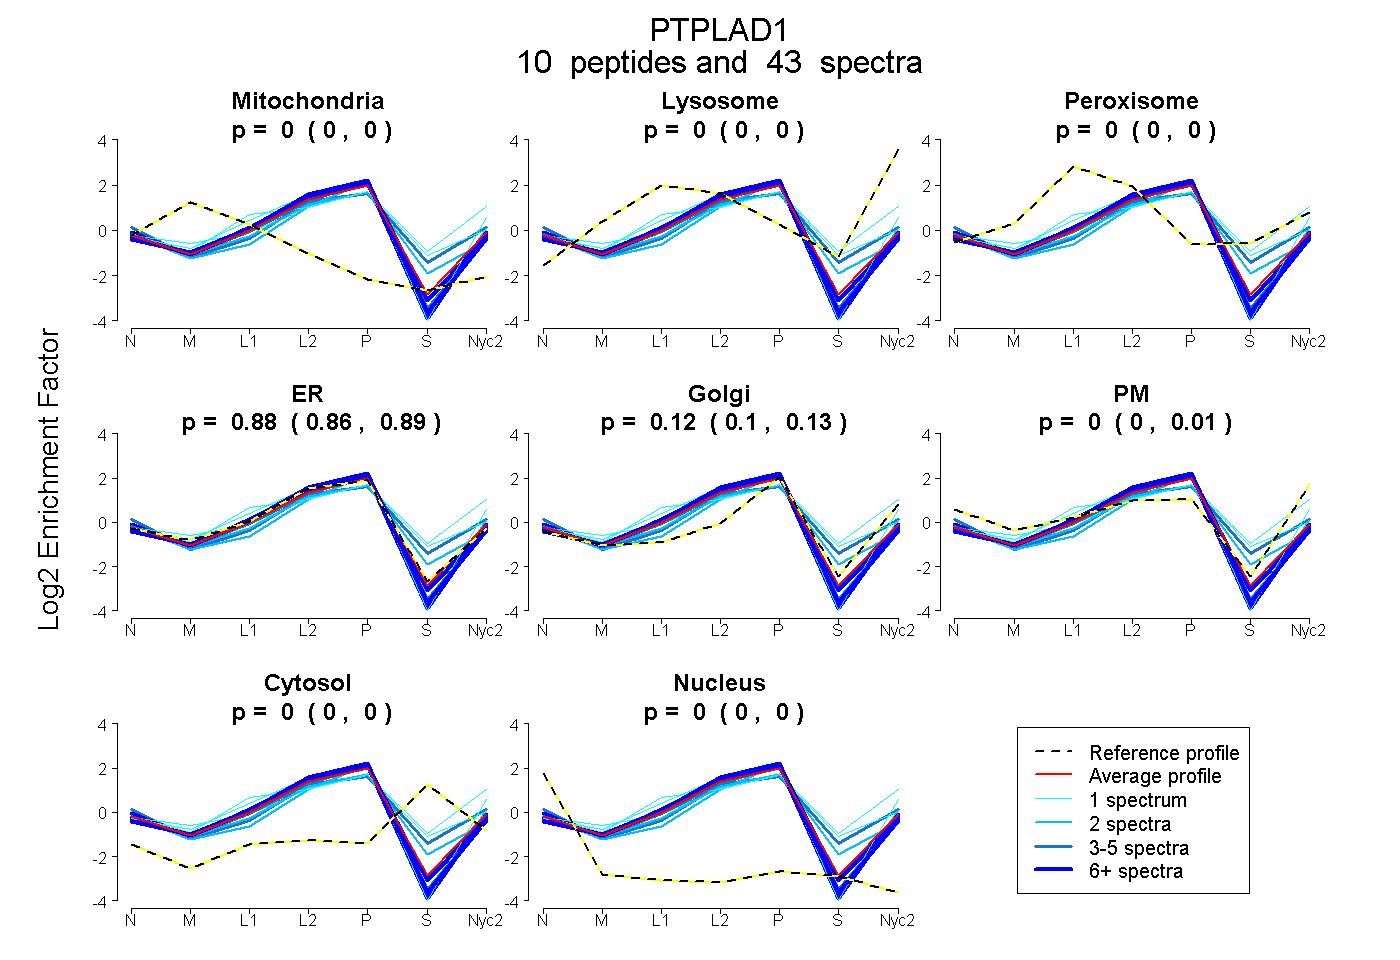
| Expt A |
10 peptides |
43 spectra |
|
0.000 0.000 | 0.000 |
0.000 0.000 | 0.000 |
0.000 0.000 | 0.000 |
0.877 0.864 | 0.888 |
0.120 0.104 | 0.129 |
0.003 0.000 | 0.014 |
0.000 0.000 | 0.000 |
0.000 0.000 | 0.003 |
| 2 spectra, FFILGK | 0.000 | 0.000 | 0.000 | 0.643 | 0.341 | 0.000 | 0.000 | 0.016 | ||
| 13 spectra, RPLFLAPDFDR | 0.000 | 0.000 | 0.000 | 0.980 | 0.019 | 0.000 | 0.000 | 0.000 | ||
| 1 spectrum, METQVLTPHVYWAQR | 0.000 | 0.093 | 0.285 | 0.118 | 0.475 | 0.000 | 0.029 | 0.000 | ||
| 1 spectrum, GSHWWER | 0.000 | 0.000 | 0.150 | 0.510 | 0.216 | 0.000 | 0.125 | 0.000 | ||
| 5 spectra, QVNITVQK | 0.000 | 0.000 | 0.000 | 0.941 | 0.039 | 0.000 | 0.000 | 0.020 | ||
| 2 spectra, LESEGSPETLTNLK | 0.000 | 0.000 | 0.000 | 0.850 | 0.007 | 0.000 | 0.143 | 0.000 | ||
| 8 spectra, WLDESDAEMELR | 0.000 | 0.000 | 0.000 | 1.000 | 0.000 | 0.000 | 0.000 | 0.000 | ||
| 1 spectrum, VLTWLR | 0.000 | 0.000 | 0.000 | 0.793 | 0.000 | 0.207 | 0.000 | 0.000 | ||
| 6 spectra, FSFTLPYPLR | 0.000 | 0.000 | 0.000 | 0.971 | 0.023 | 0.006 | 0.000 | 0.000 | ||
| 4 spectra, AQGHGAK | 0.000 | 0.000 | 0.000 | 0.634 | 0.000 | 0.200 | 0.166 | 0.000 |
| Plot | Mito | Lyso or Perox | ER | Golgi | PM | Cytosol | Nucleus | ||||||
| Expt B |
4 peptides |
15 spectra |
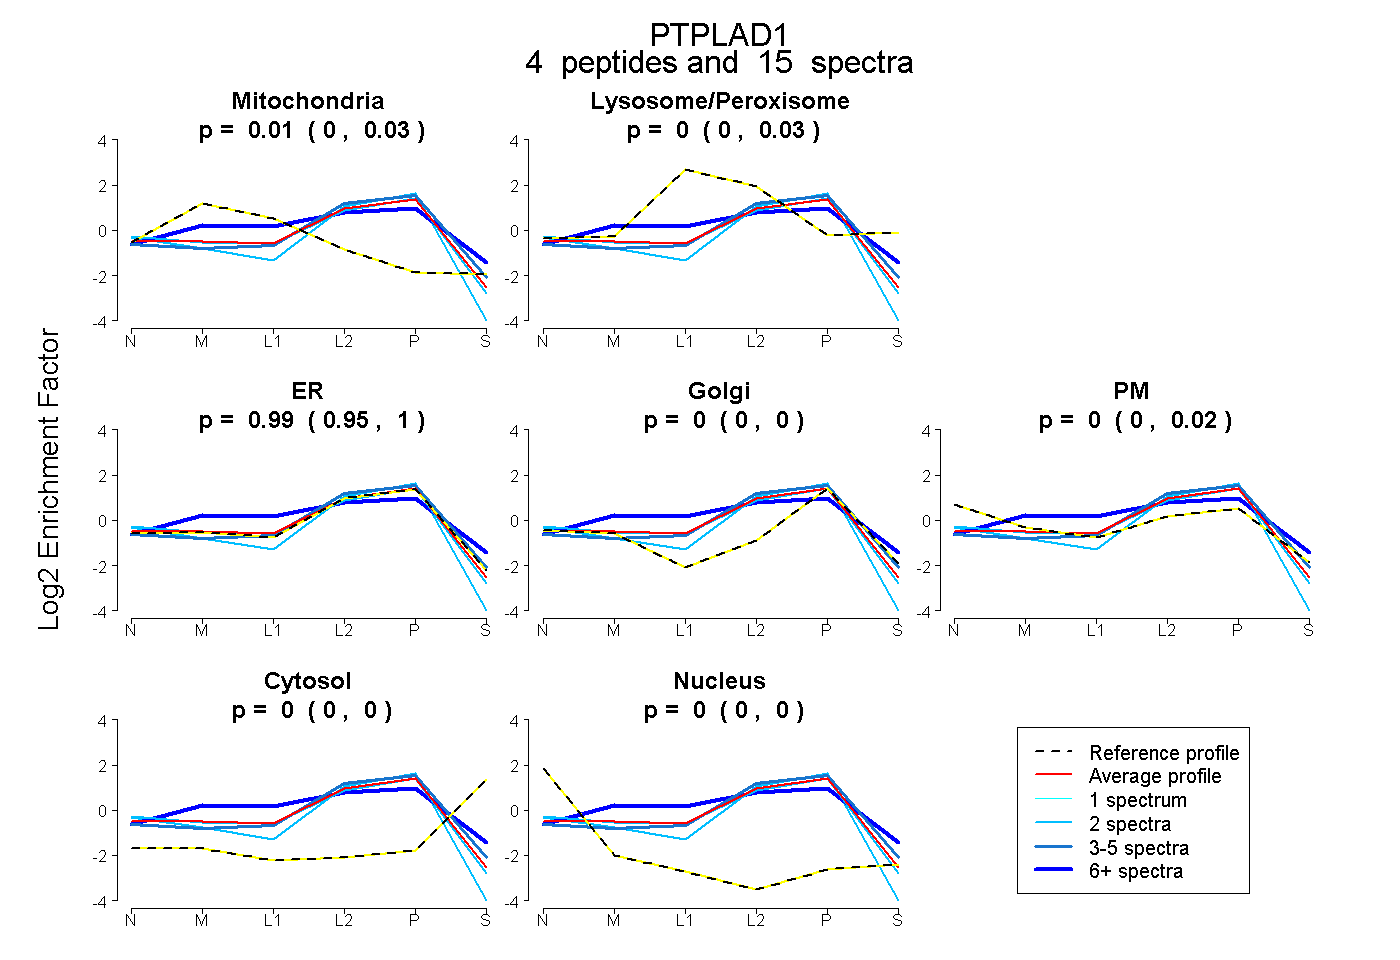 |
0.011 0.000 | 0.025 |
0.000 0.000 | 0.027 |
0.989 0.947 | 1.000 |
0.000 0.000 | 0.000 |
0.000 0.000 | 0.024 |
0.000 0.000 | 0.000 |
0.000 0.000 | 0.003 |
|||
| Plot | Lyso | Other | |||||||||||
| Expt C |
10 peptides |
52 spectra |
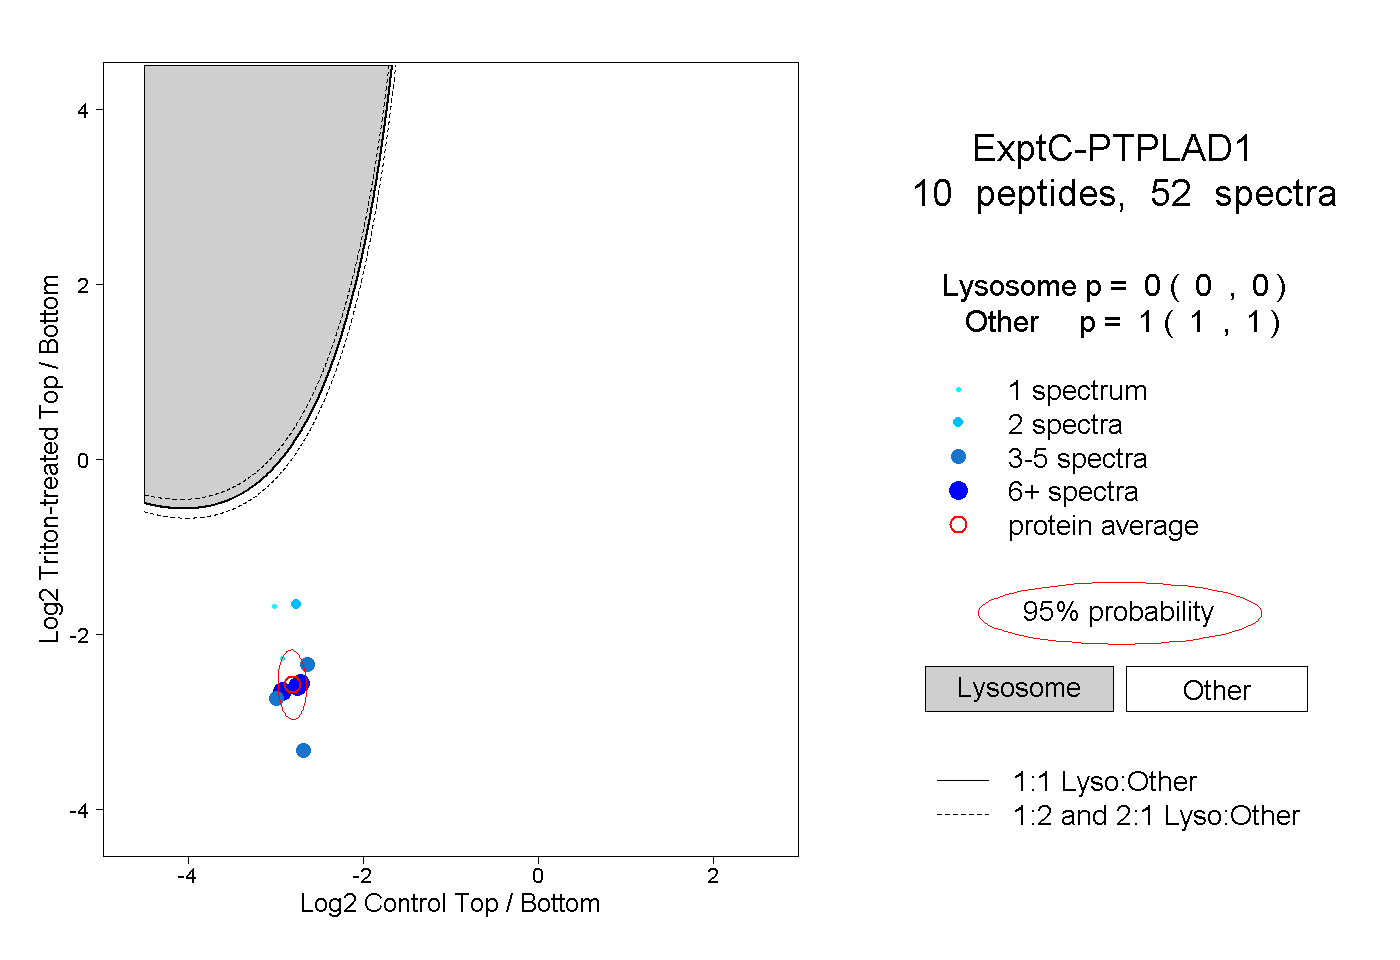 |
0.000 0.000 | 0.000 |
1.000 1.000 | 1.000 |
||||||||
| Plot | Lyso | Other | |||||||||||
| Expt D |
4 peptides |
7 spectra |
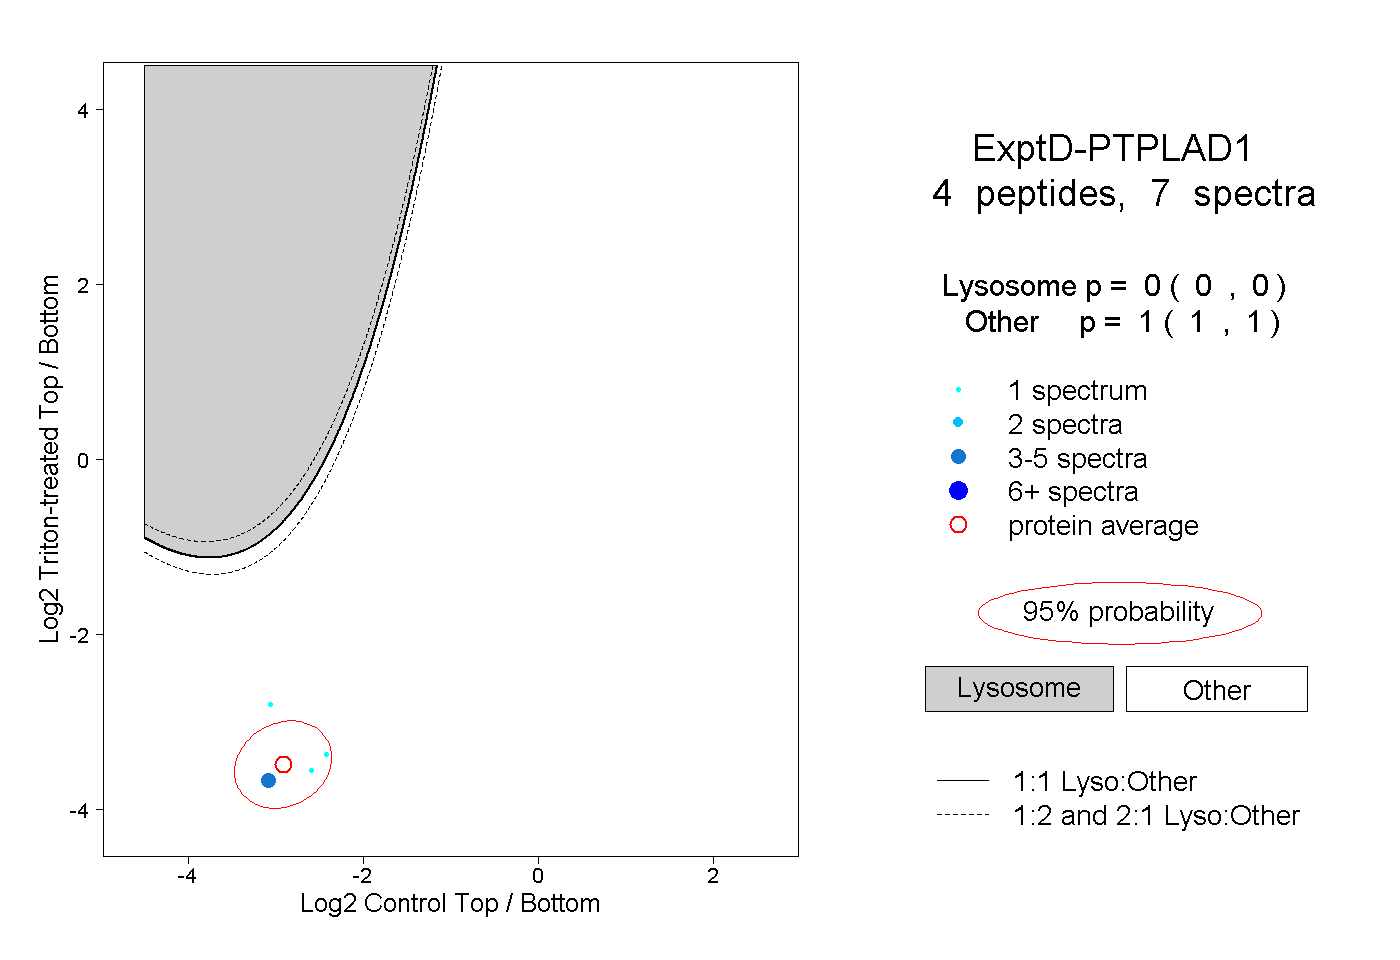 |
0.000 0.000 | 0.000 |
1.000 1.000 | 1.000 |