 9
9peptides
spectra
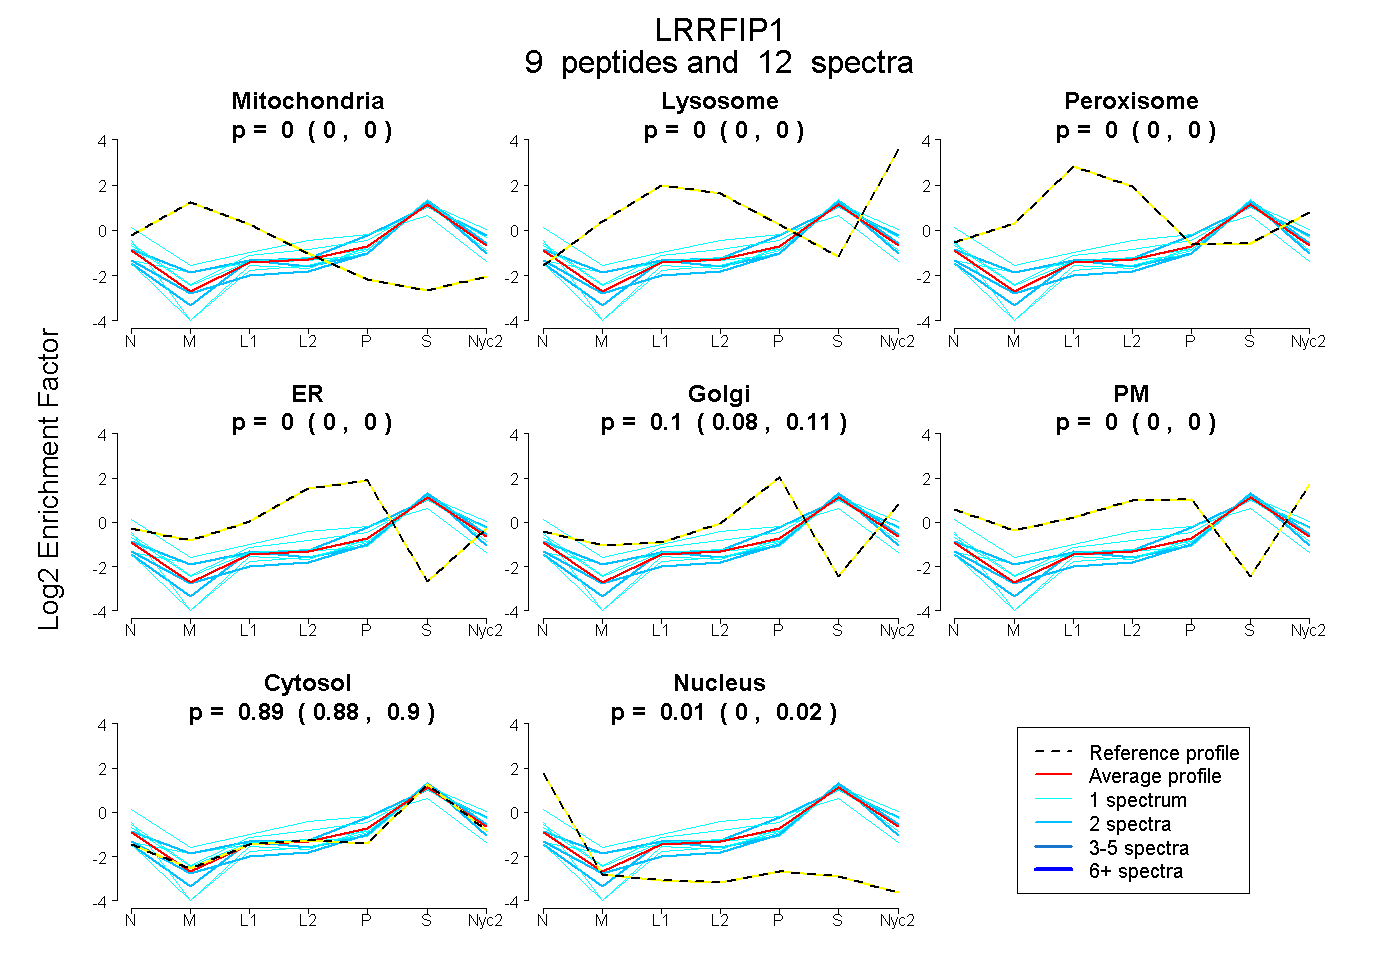
0.000 | 0.000
0.000 | 0.000
0.000 | 0.000
0.000 | 0.000
0.084 | 0.108
0.000 | 0.000
0.881 | 0.905
0.000 | 0.018
| Plot | Mito | Lyso | Perox | ER | Golgi | PM | Cytosol | Nucleus | |||||
| Expt A |
9 peptides |
12 spectra |
|
0.000 0.000 | 0.000 |
0.000 0.000 | 0.000 |
0.000 0.000 | 0.000 |
0.000 0.000 | 0.000 |
0.097 0.084 | 0.108 |
0.000 0.000 | 0.000 |
0.894 0.881 | 0.905 |
0.009 0.000 | 0.018 |
| 2 spectra, EELDALK | 0.000 | 0.015 | 0.000 | 0.000 | 0.211 | 0.000 | 0.775 | 0.000 | ||
| 1 spectrum, EIDCLSPEAQR | 0.000 | 0.000 | 0.000 | 0.000 | 0.000 | 0.000 | 0.981 | 0.019 | ||
| 2 spectra, SLNDGLGQSSER | 0.000 | 0.000 | 0.000 | 0.000 | 0.000 | 0.000 | 0.947 | 0.053 | ||
| 1 spectrum, GSFEPRPDHVLGQTPEIDK | 0.000 | 0.000 | 0.078 | 0.231 | 0.000 | 0.000 | 0.593 | 0.098 | ||
| 1 spectrum, EDPQSRPSGK | 0.053 | 0.003 | 0.000 | 0.000 | 0.032 | 0.000 | 0.912 | 0.000 | ||
| 1 spectrum, SPEQIESHEVTNK | 0.000 | 0.000 | 0.000 | 0.082 | 0.006 | 0.087 | 0.824 | 0.000 | ||
| 1 spectrum, NQSENSMDSQGK | 0.000 | 0.000 | 0.000 | 0.000 | 0.059 | 0.000 | 0.913 | 0.028 | ||
| 1 spectrum, VSCTDSR | 0.000 | 0.000 | 0.000 | 0.000 | 0.000 | 0.122 | 0.878 | 0.000 | ||
| 2 spectra, DSLAEVEEK | 0.000 | 0.000 | 0.000 | 0.000 | 0.000 | 0.000 | 1.000 | 0.000 |
| Plot | Mito | Lyso or Perox | ER | Golgi | PM | Cytosol | Nucleus | ||||||
| Expt B |
1 peptide |
1 spectrum |
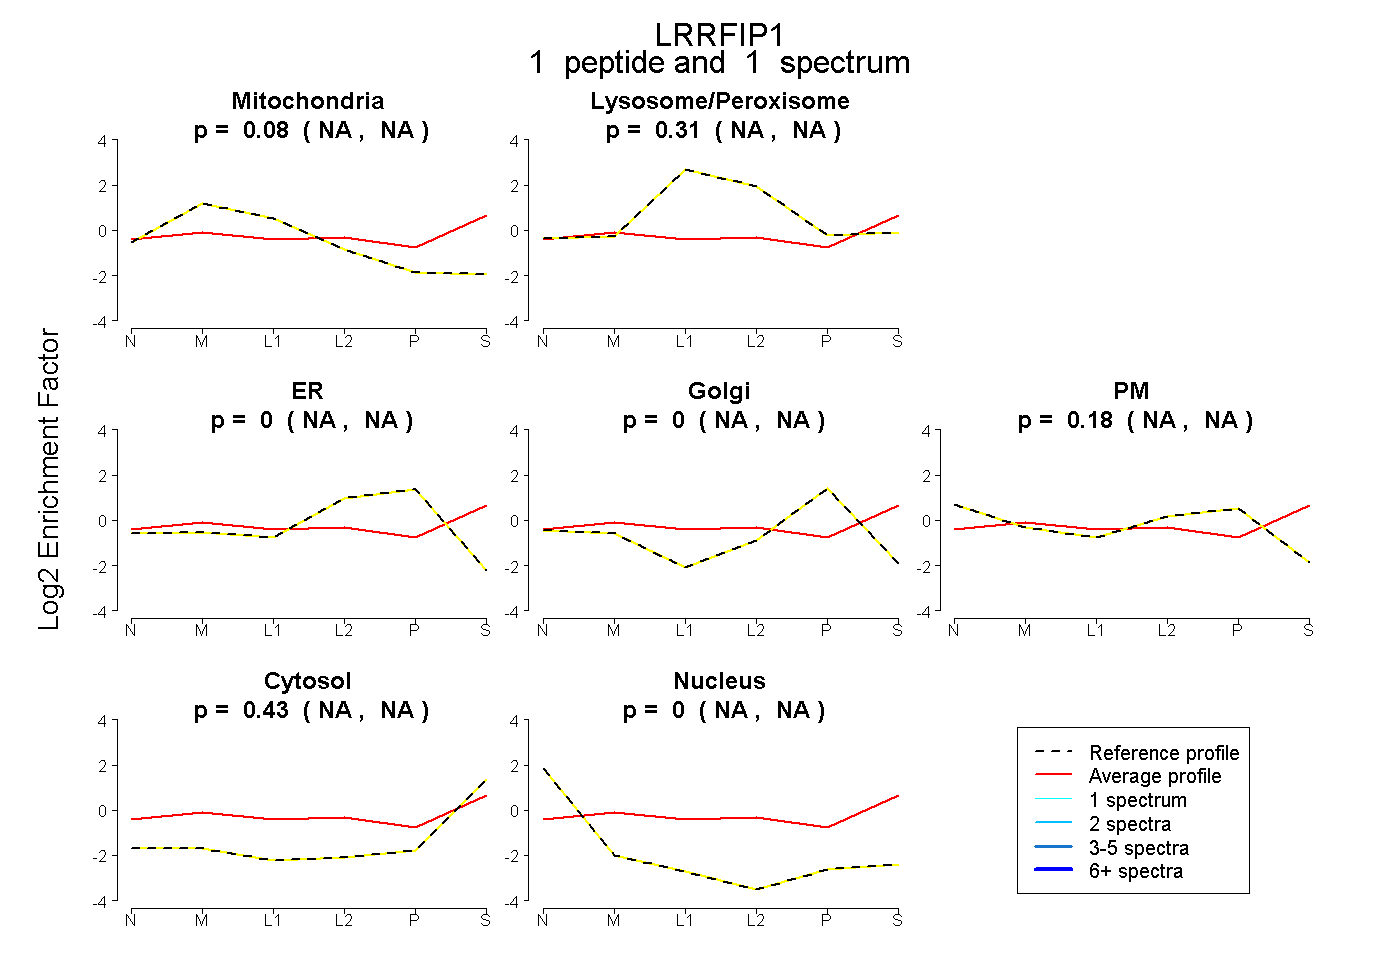 |
0.079 NA | NA |
0.309 NA | NA |
0.000 NA | NA |
0.000 NA | NA |
0.180 NA | NA |
0.432 NA | NA |
0.000 NA | NA |
|||
| Plot | Lyso | Other | |||||||||||
| Expt C |
2 peptides |
3 spectra |
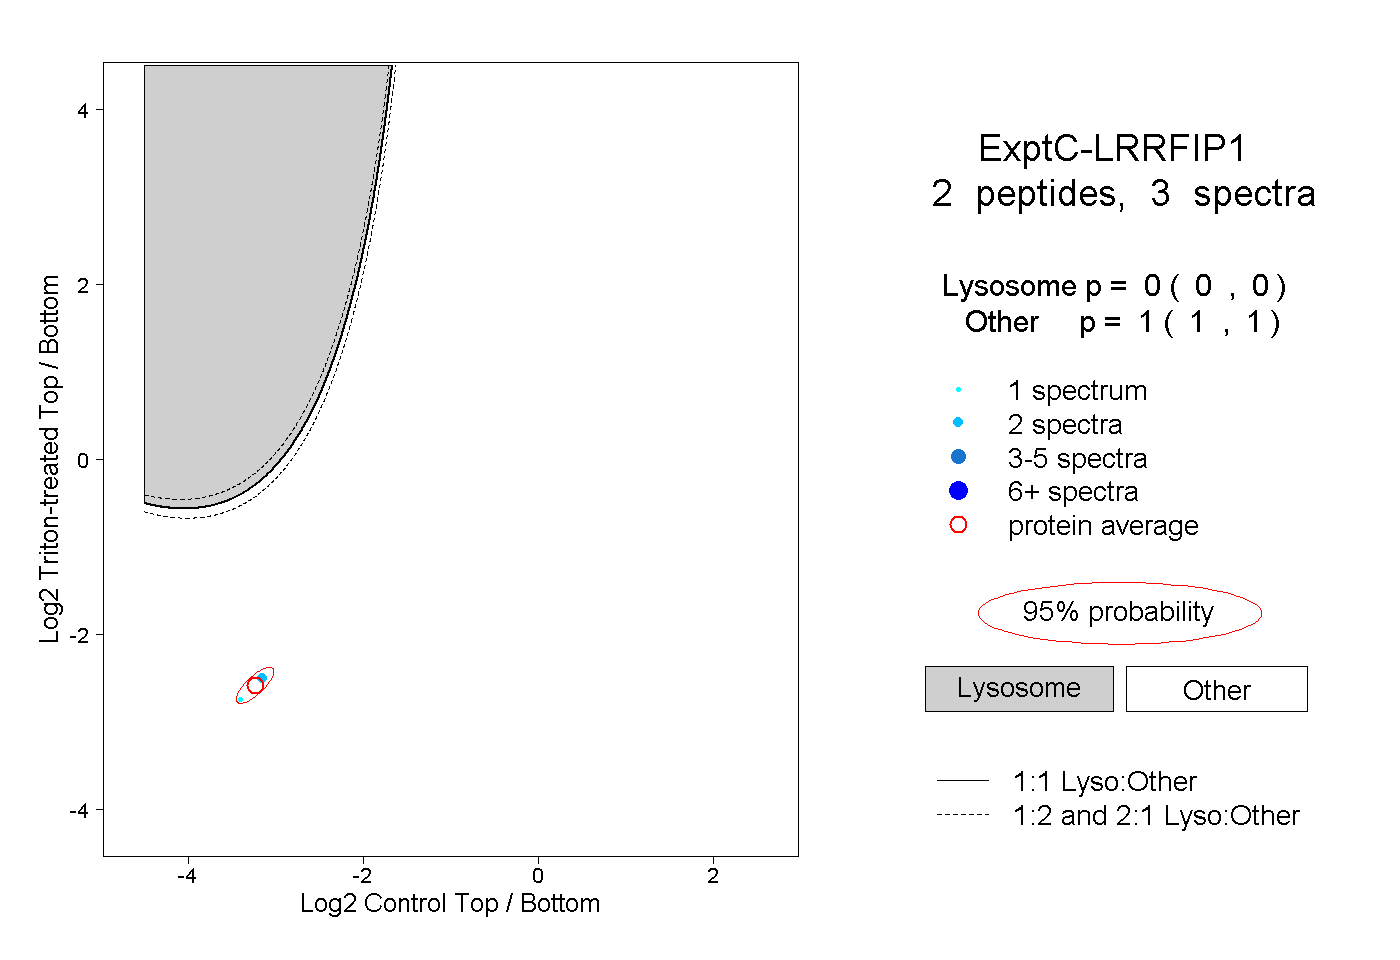 |
0.000 0.000 | 0.000 |
1.000 1.000 | 1.000 |