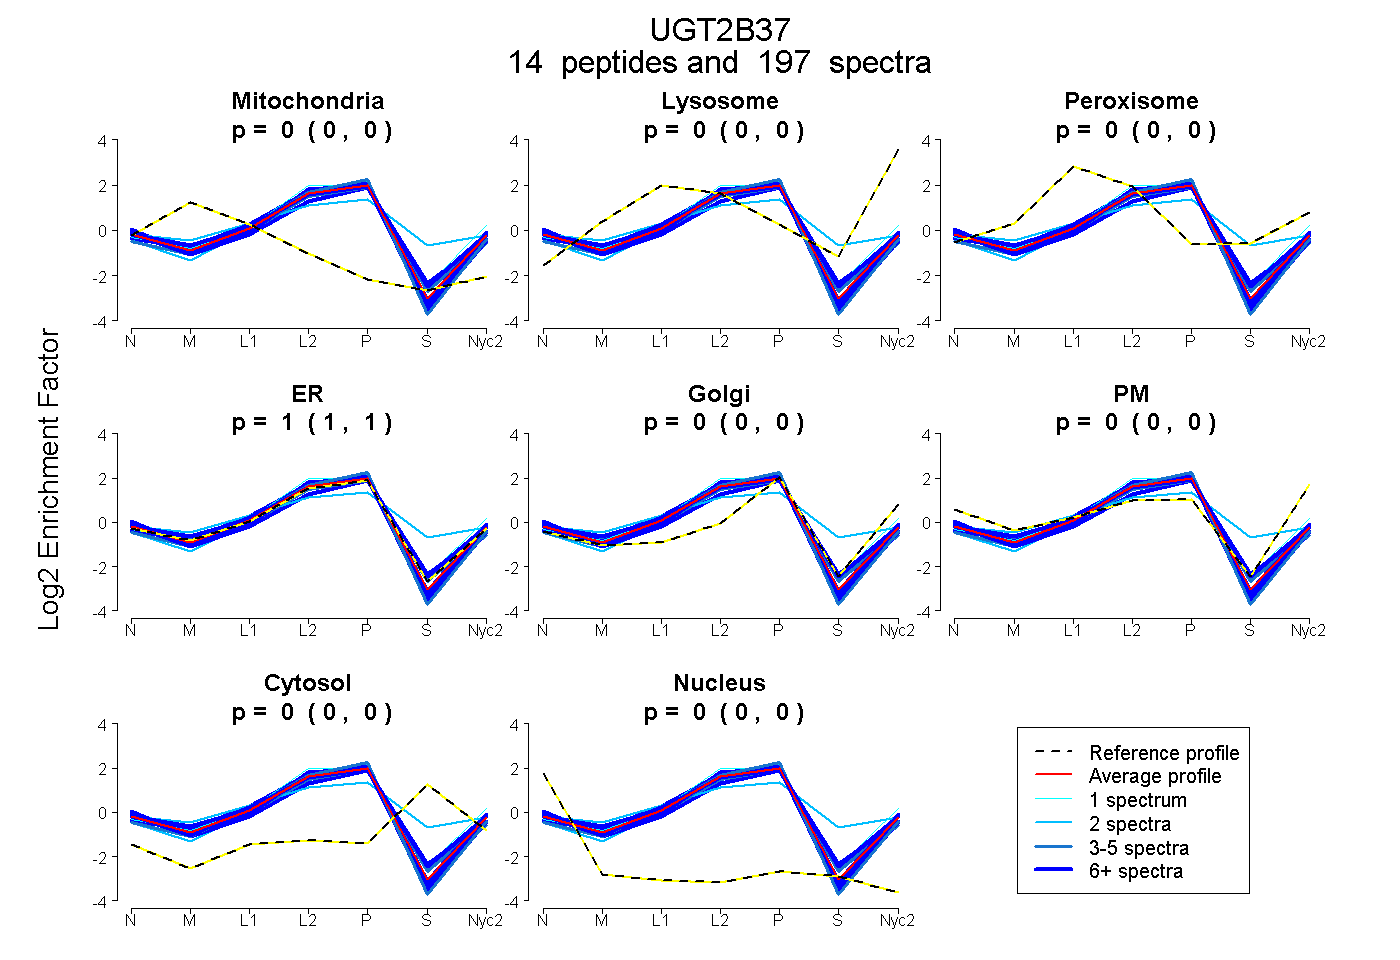
 14
14peptides
spectra
0.000 | 0.000
0.000 | 0.000
0.000 | 0.000
1.000 | 1.000
0.000 | 0.000
0.000 | 0.000
0.000 | 0.000
0.000 | 0.000
| Plot | Mito | Lyso | Perox | ER | Golgi | PM | Cytosol | Nucleus | |||||
| Expt A |
14 peptides |
197 spectra |
|
0.000 0.000 | 0.000 |
0.000 0.000 | 0.000 |
0.000 0.000 | 0.000 |
1.000 1.000 | 1.000 |
0.000 0.000 | 0.000 |
0.000 0.000 | 0.000 |
0.000 0.000 | 0.000 |
0.000 0.000 | 0.000 |
| 11 spectra, ASPGHK | 0.000 | 0.000 | 0.000 | 0.898 | 0.043 | 0.000 | 0.024 | 0.036 | ||
| 1 spectrum, NWDPFYTEILGRPTTLAETMGK | 0.000 | 0.083 | 0.000 | 0.917 | 0.000 | 0.000 | 0.000 | 0.000 | ||
| 13 spectra, AIFWIEYVMR | 0.000 | 0.000 | 0.000 | 0.956 | 0.000 | 0.044 | 0.000 | 0.000 | ||
| 40 spectra, AEMCLIR | 0.000 | 0.000 | 0.000 | 1.000 | 0.000 | 0.000 | 0.000 | 0.000 | ||
| 38 spectra, TILDELVQR | 0.000 | 0.000 | 0.000 | 1.000 | 0.000 | 0.000 | 0.000 | 0.000 | ||
| 2 spectra, ANAVAWALAQIPQK | 0.000 | 0.000 | 0.000 | 1.000 | 0.000 | 0.000 | 0.000 | 0.000 | ||
| 21 spectra, SDLFNALK | 0.000 | 0.000 | 0.000 | 0.948 | 0.000 | 0.052 | 0.000 | 0.000 | ||
| 2 spectra, EVINNPFYK | 0.000 | 0.000 | 0.237 | 0.552 | 0.036 | 0.000 | 0.175 | 0.000 | ||
| 15 spectra, LVDAWTYELQR | 0.000 | 0.000 | 0.000 | 1.000 | 0.000 | 0.000 | 0.000 | 0.000 | ||
| 34 spectra, GAAVTLNIR | 0.000 | 0.000 | 0.000 | 0.993 | 0.000 | 0.007 | 0.000 | 0.000 | ||
| 9 spectra, VLVWPMEYSHWMNLK | 0.000 | 0.000 | 0.013 | 0.953 | 0.000 | 0.022 | 0.012 | 0.000 | ||
| 4 spectra, CFLFIYR | 0.003 | 0.000 | 0.000 | 0.974 | 0.000 | 0.000 | 0.000 | 0.023 | ||
| 3 spectra, VLVWPMEFSHWMNIK | 0.000 | 0.000 | 0.000 | 1.000 | 0.000 | 0.000 | 0.000 | 0.000 | ||
| 4 spectra, FETFPTSVSK | 0.000 | 0.000 | 0.000 | 0.986 | 0.000 | 0.000 | 0.000 | 0.014 |
| Plot | Mito | Lyso or Perox | ER | Golgi | PM | Cytosol | Nucleus | ||||||
| Expt B |
12 peptides |
133 spectra |
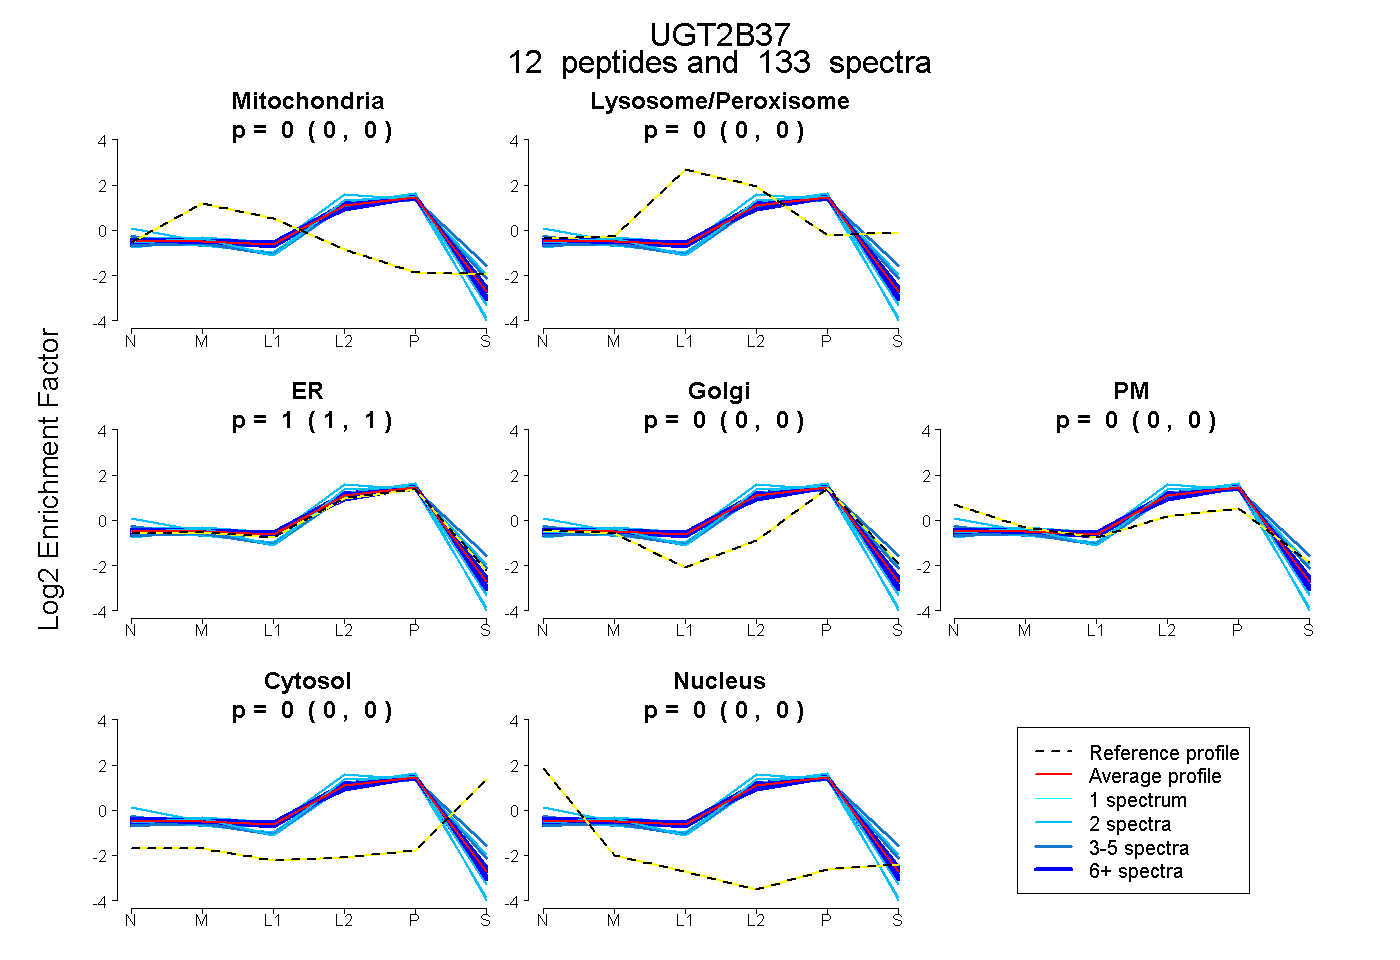 |
0.000 0.000 | 0.000 |
0.000 0.000 | 0.000 |
1.000 1.000 | 1.000 |
0.000 0.000 | 0.000 |
0.000 0.000 | 0.000 |
0.000 0.000 | 0.000 |
0.000 0.000 | 0.000 |
|||
| Plot | Lyso | Other | |||||||||||
| Expt C |
13 peptides |
306 spectra |
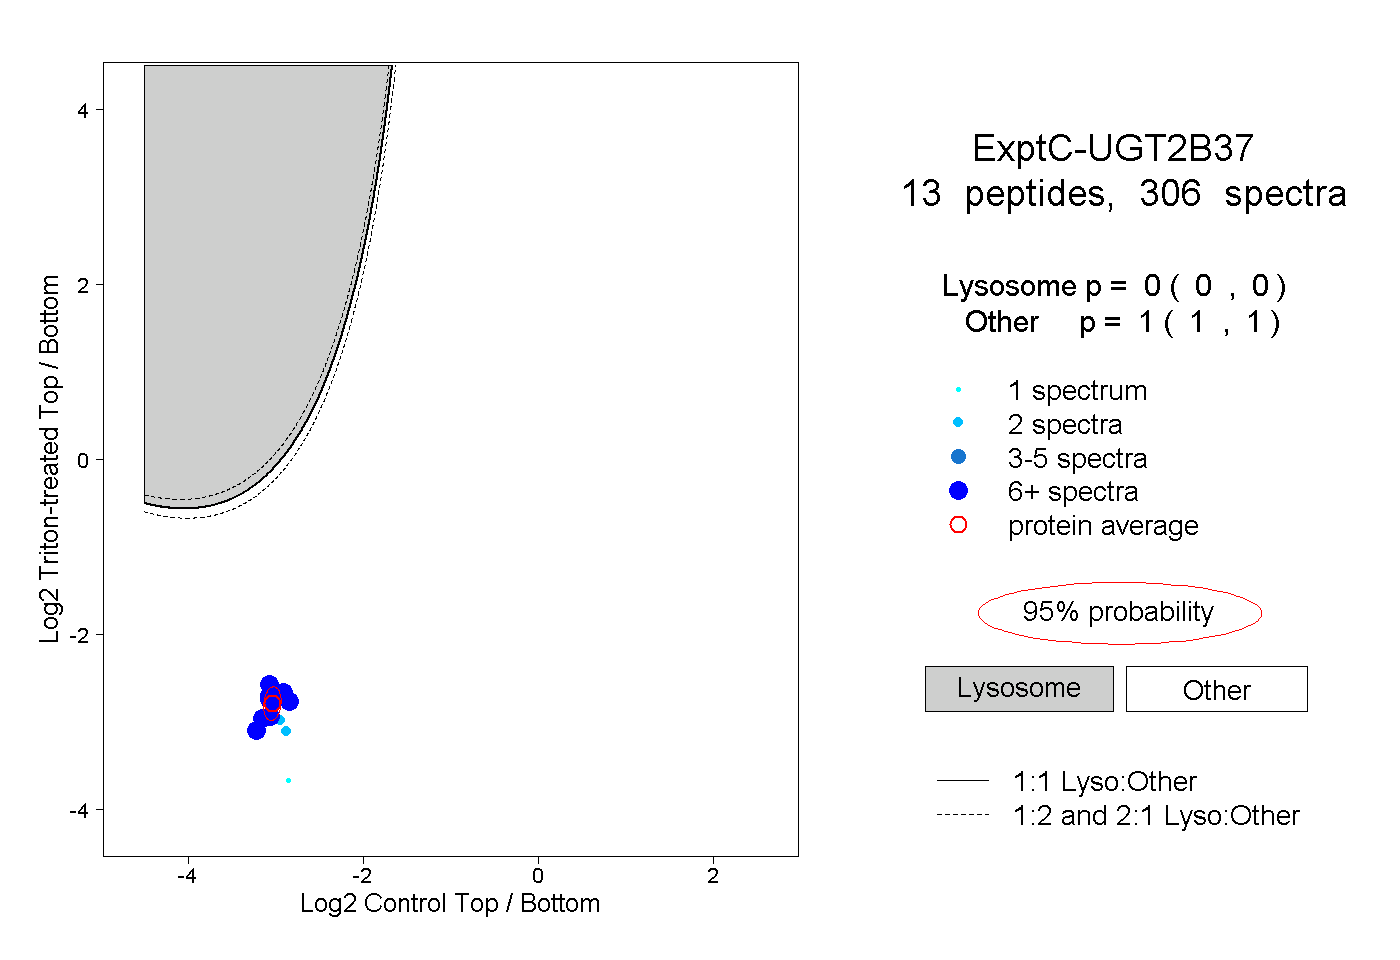 |
0.000 0.000 | 0.000 |
1.000 1.000 | 1.000 |
||||||||
| Plot | Lyso | Other | |||||||||||
| Expt D |
5 peptides |
26 spectra |
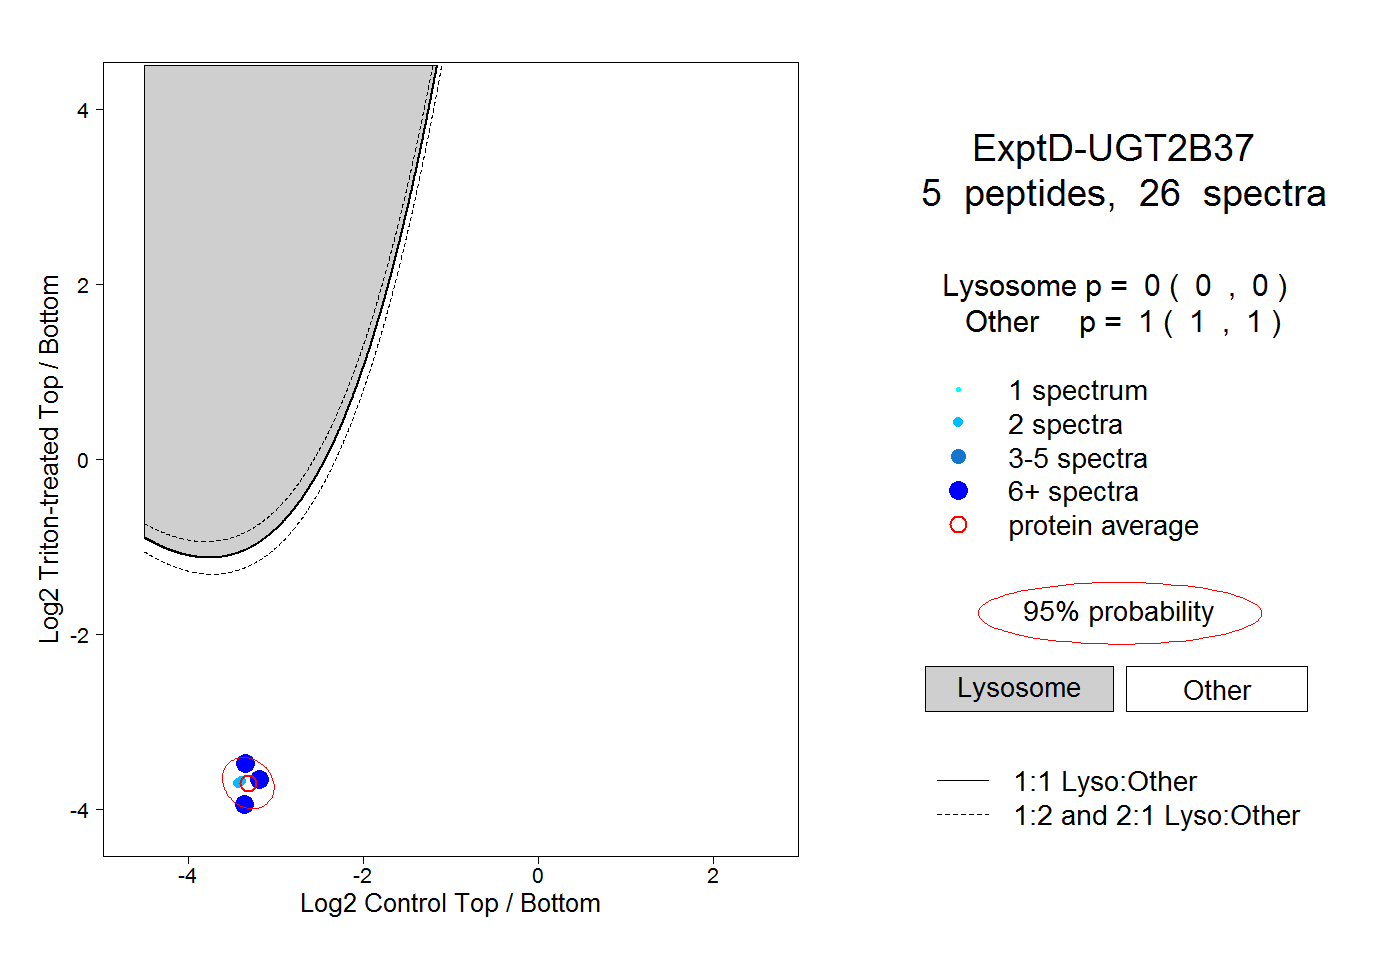 |
0.000 0.000 | 0.000 |
1.000 1.000 | 1.000 |