 7
7peptides
spectra
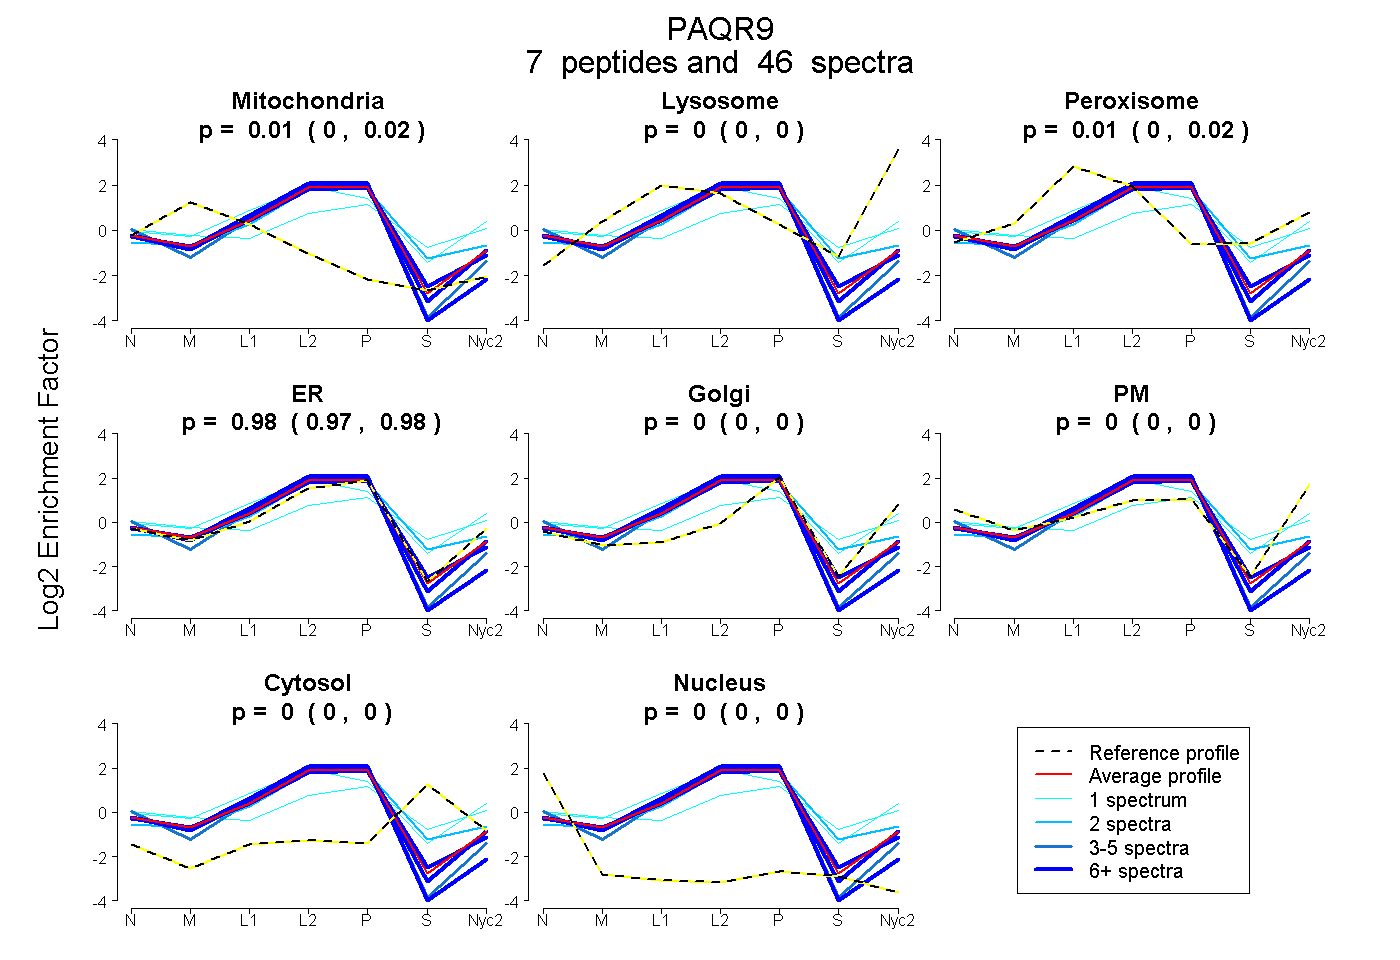
0.003 | 0.020
0.000 | 0.000
0.000 | 0.025
0.966 | 0.984
0.000 | 0.000
0.000 | 0.000
0.000 | 0.000
0.000 | 0.000
2peptides
spectra
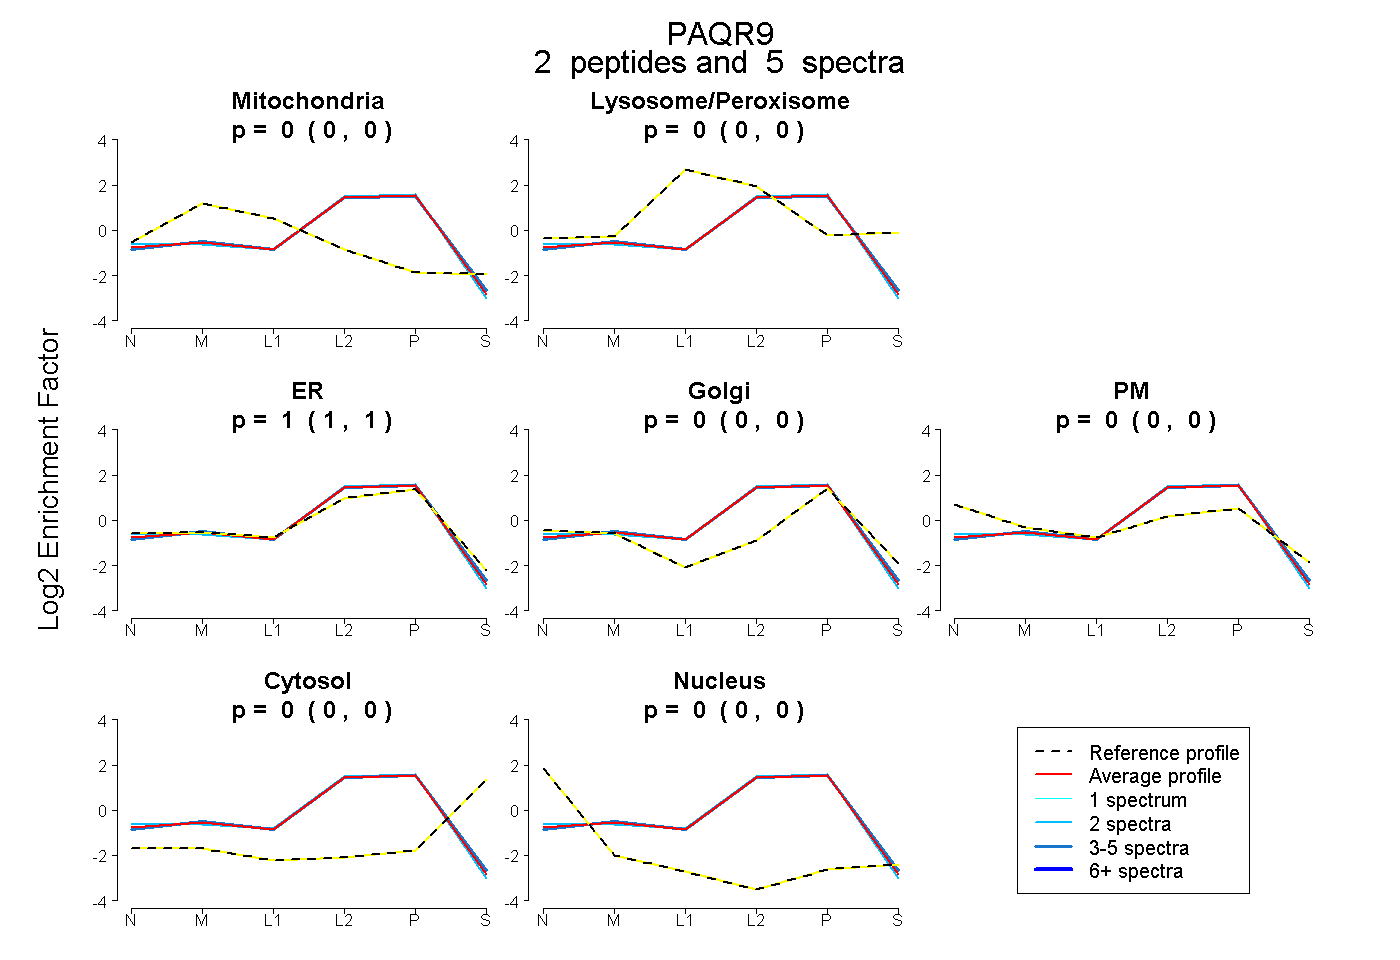
0.000 | 0.000
0.000 | 0.000
1.000 | 1.000
0.000 | 0.000
0.000 | 0.000
0.000 | 0.000
0.000 | 0.000
5peptides
spectra
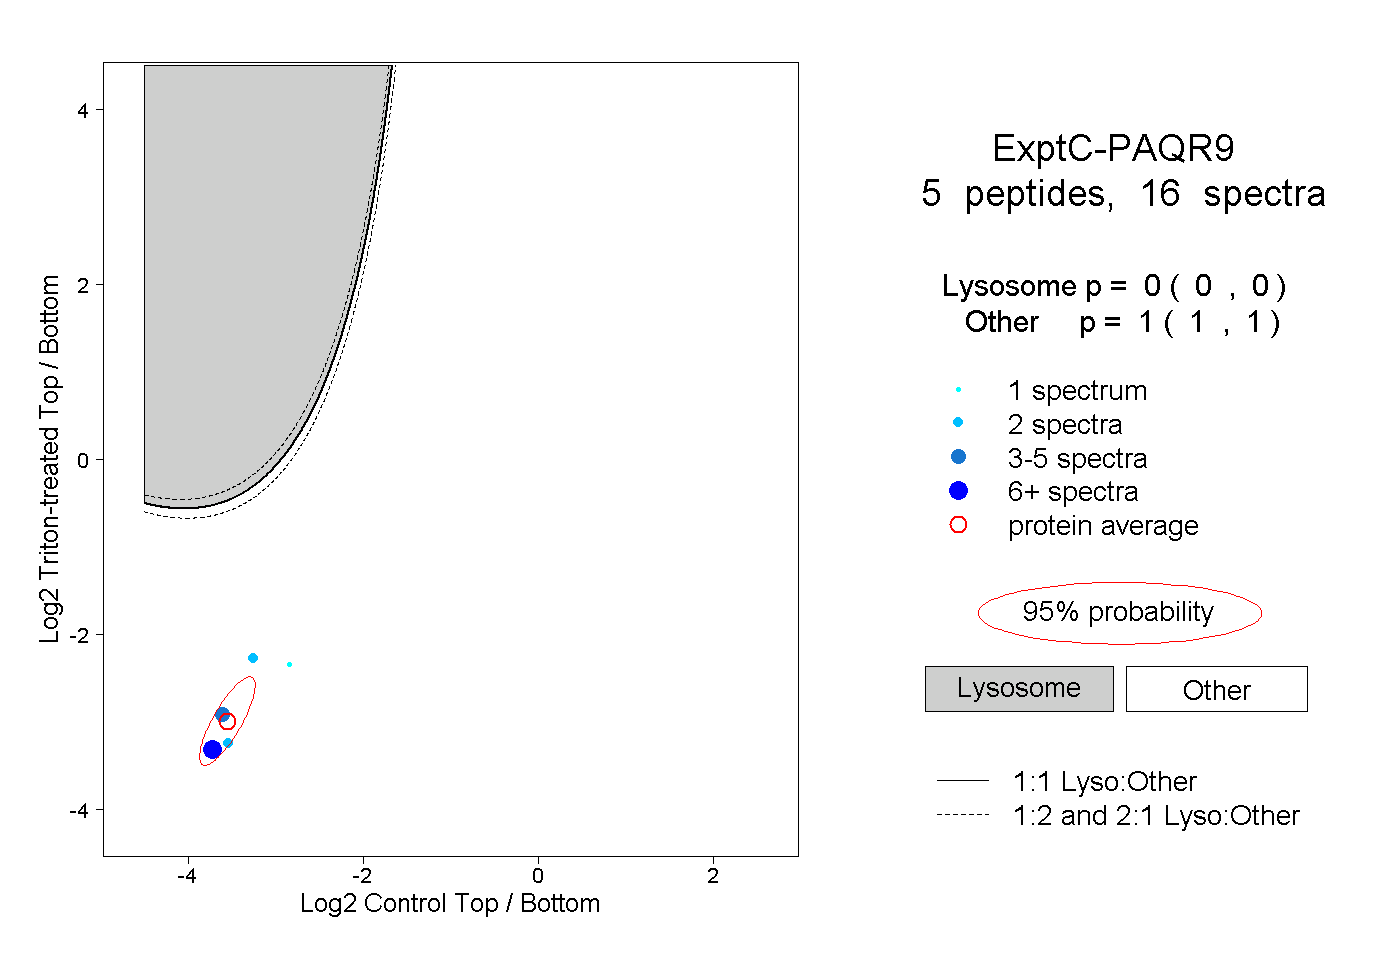
0.000 | 0.000
1.000 | 1.000
1peptide
spectra
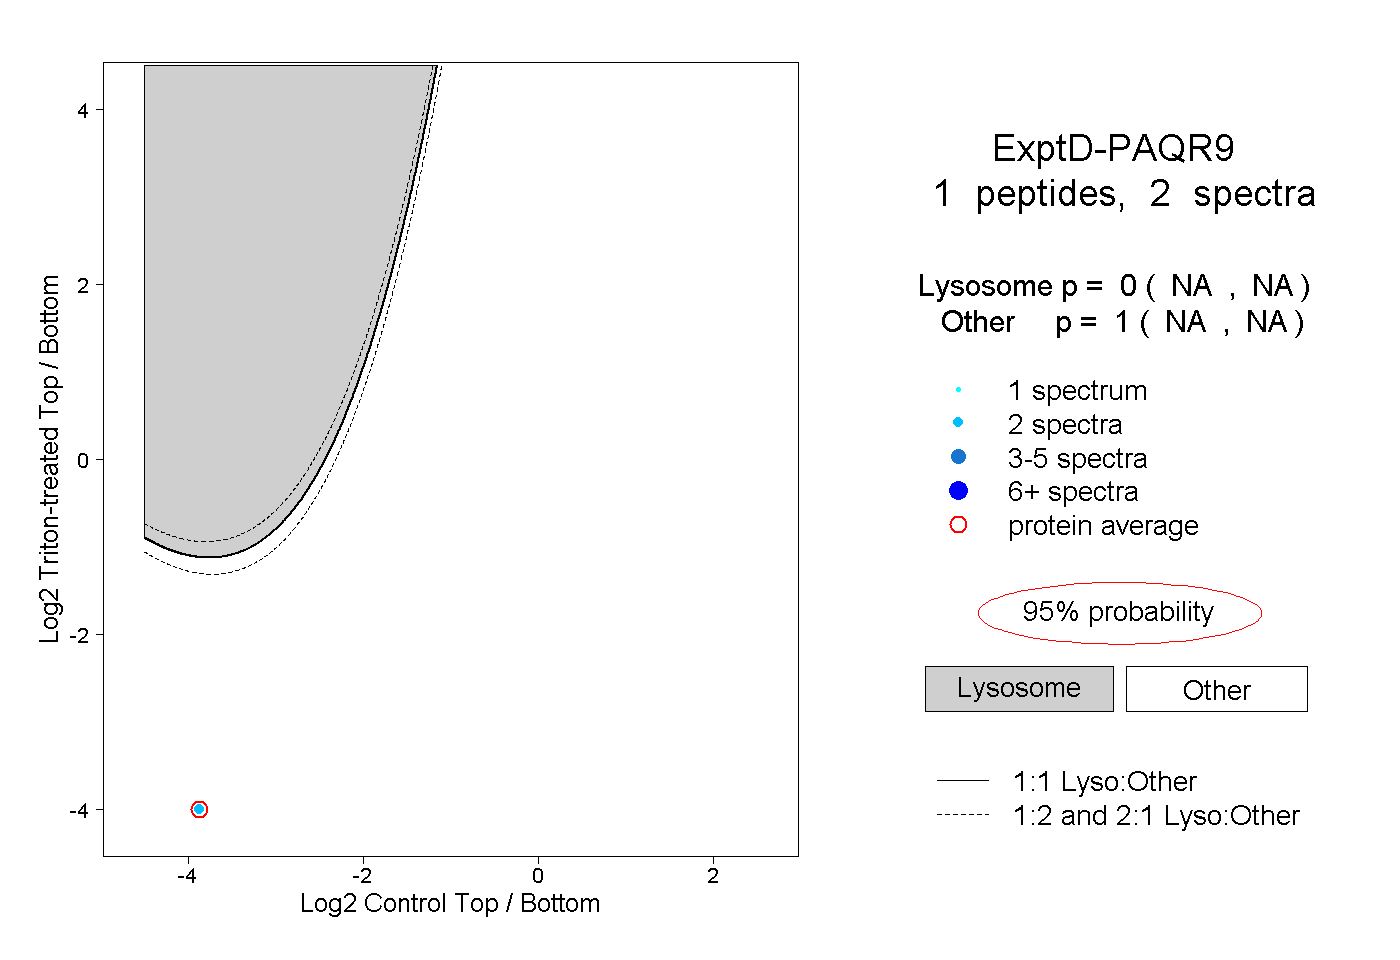
NA | NA
NA | NA