 2
2peptides
spectra
0.266 | 0.497
0.000 | 0.070
0.008 | 0.239
0.000 | 0.000
0.000 | 0.158
0.000 | 0.155
0.232 | 0.454
0.000 | 0.007
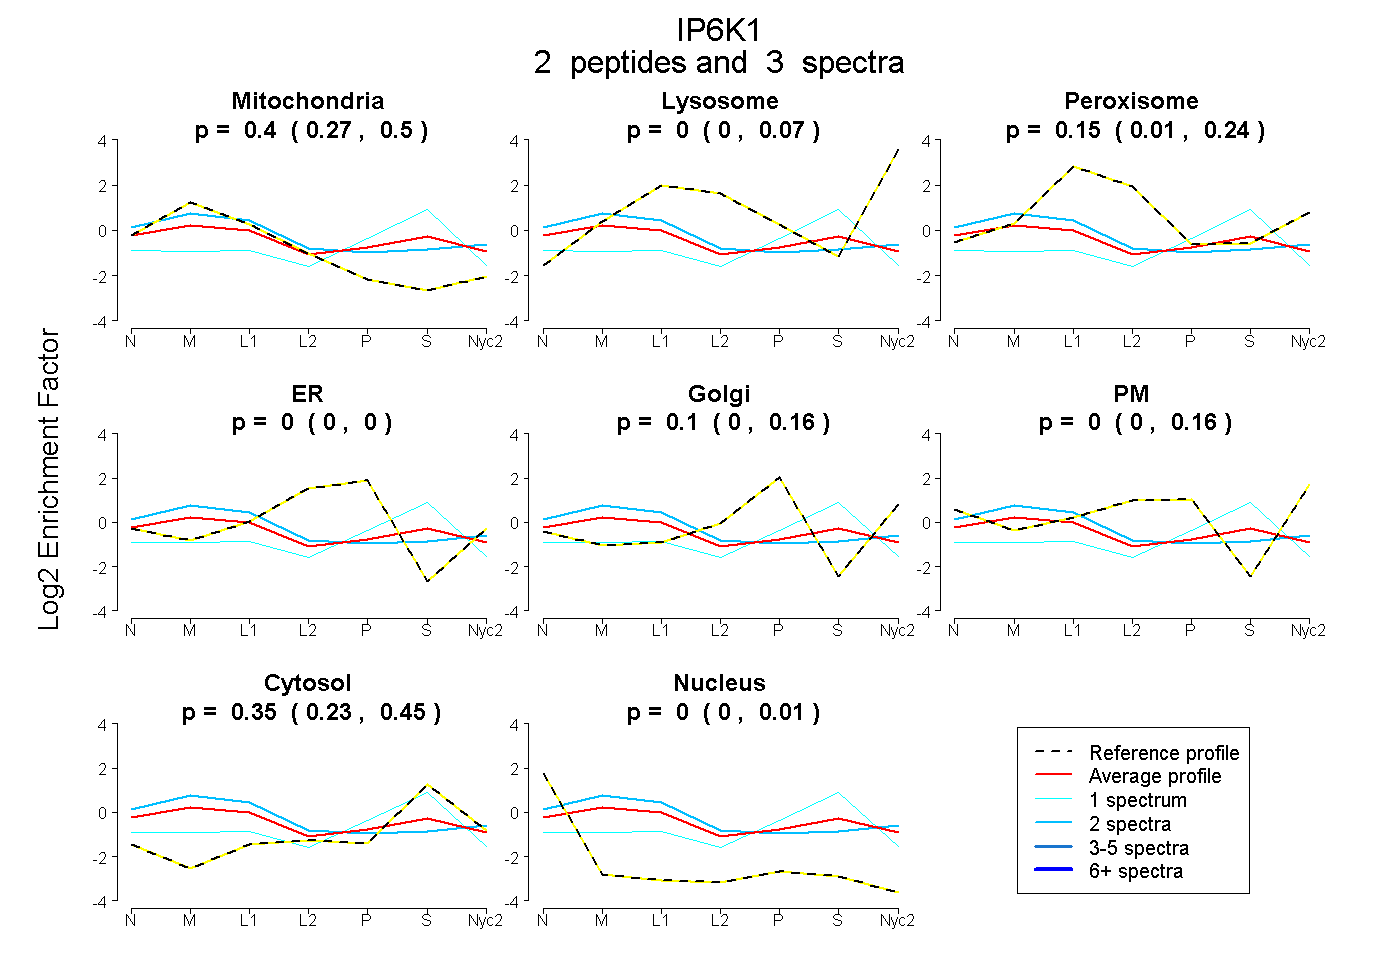
| Plot | Mito | Lyso | Perox | ER | Golgi | PM | Cytosol | Nucleus | |||||
| Expt A |
2 peptides |
3 spectra |
|
0.399 0.266 | 0.497 |
0.000 0.000 | 0.070 |
0.153 0.008 | 0.239 |
0.000 0.000 | 0.000 |
0.100 0.000 | 0.158 |
0.000 0.000 | 0.155 |
0.348 0.232 | 0.454 |
0.000 0.000 | 0.007 |
| 1 spectrum, YPCVLDLK | 0.207 | 0.000 | 0.000 | 0.000 | 0.087 | 0.000 | 0.706 | 0.000 | ||
| 2 spectra, EFTPEYK | 0.488 | 0.001 | 0.179 | 0.000 | 0.000 | 0.143 | 0.189 | 0.000 |