13
13peptides
spectra
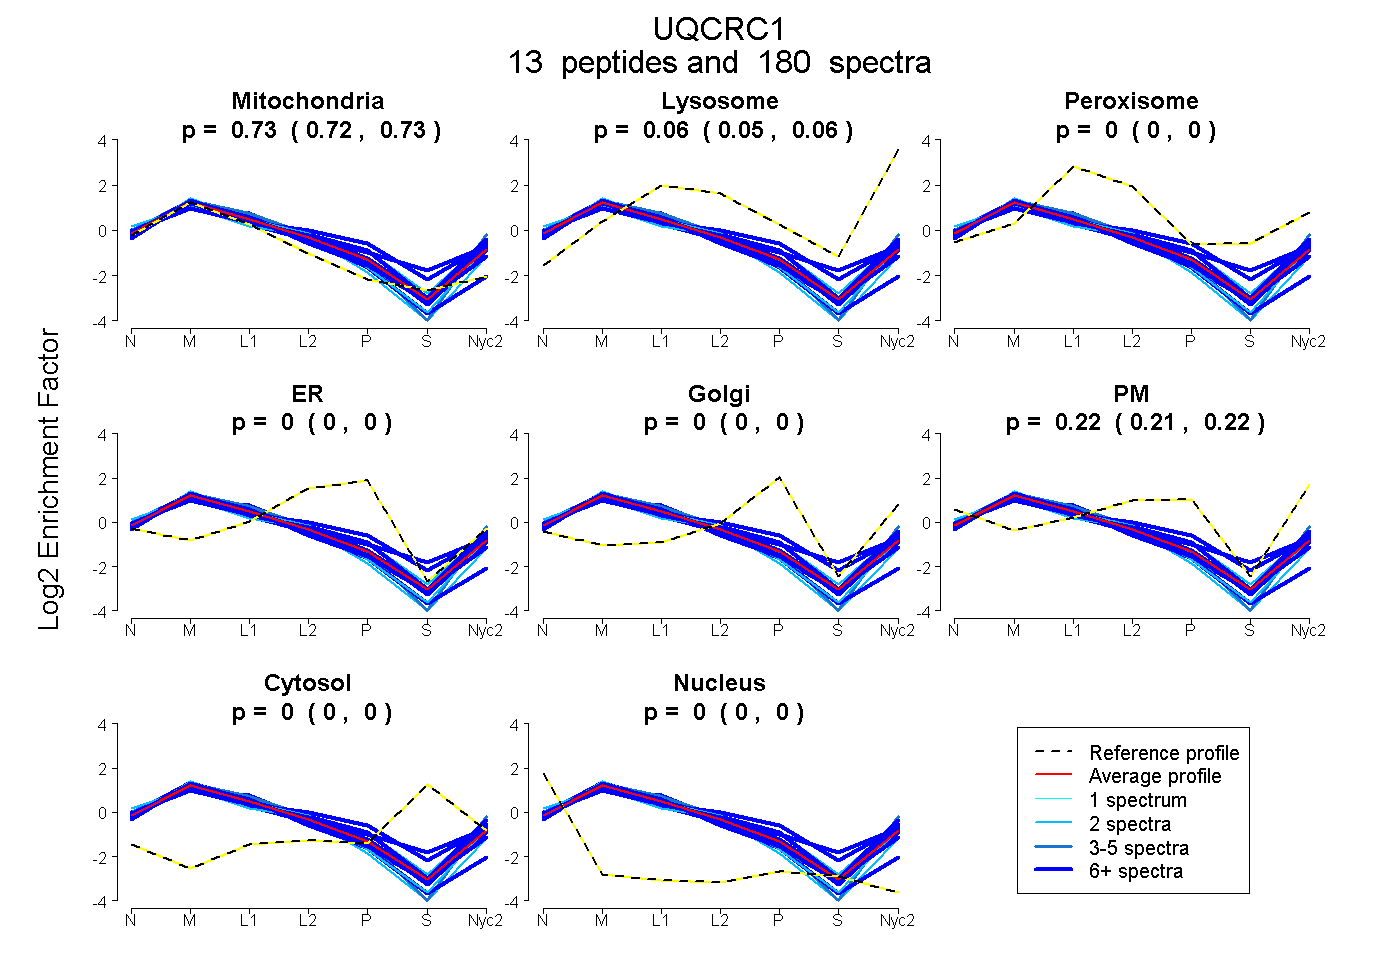
0.724 | 0.729
0.055 | 0.061
0.000 | 0.000
0.000 | 0.000
0.000 | 0.000
0.211 | 0.218
0.000 | 0.000
0.000 | 0.000
13peptides
spectra
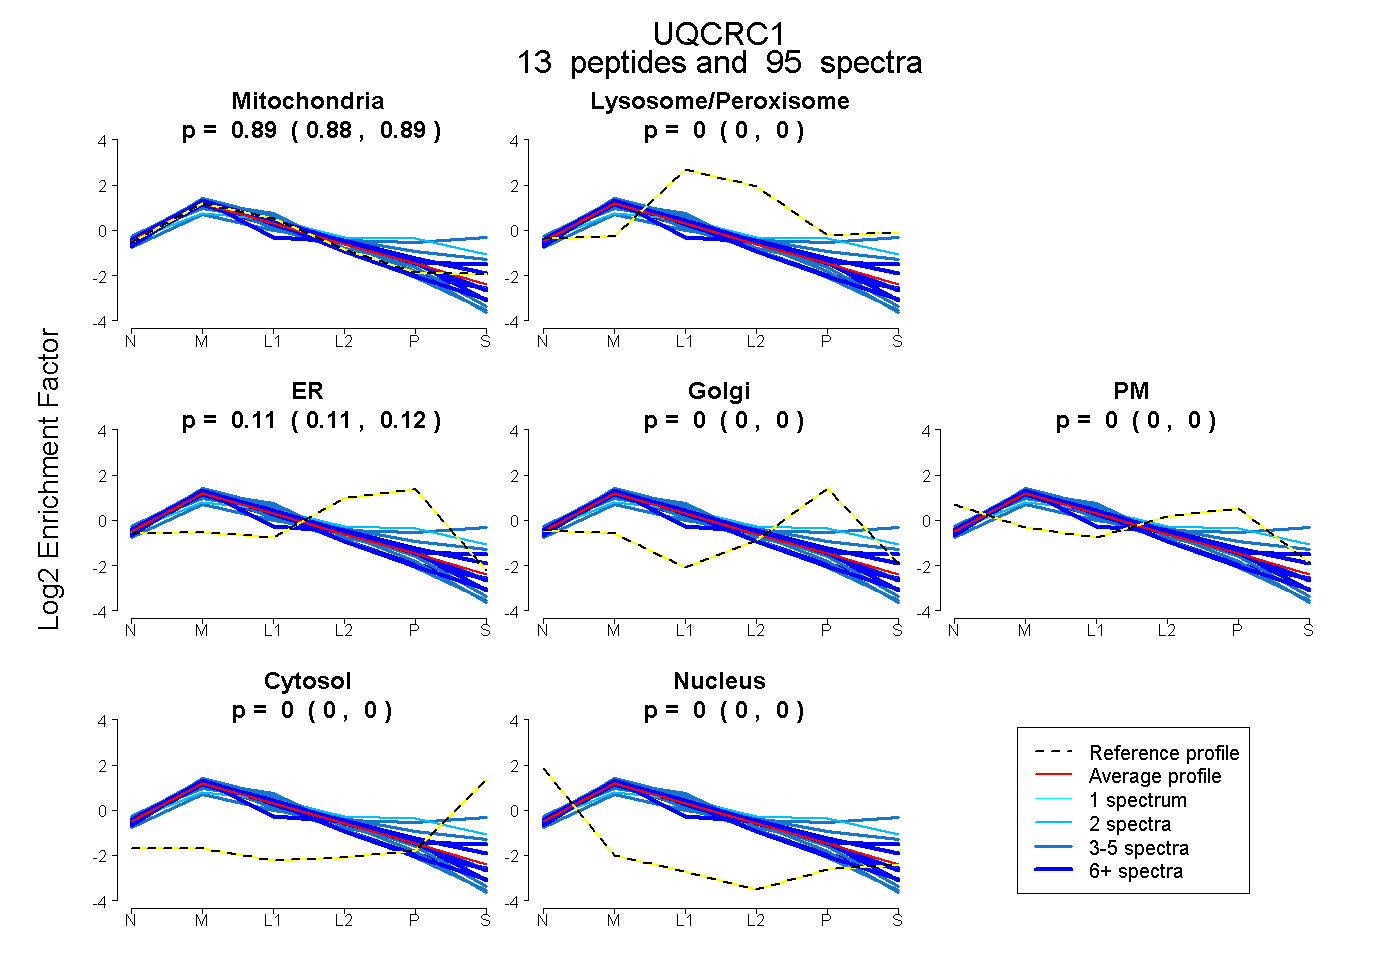
0.881 | 0.890
0.000 | 0.000
0.110 | 0.118
0.000 | 0.000
0.000 | 0.000
0.000 | 0.000
0.000 | 0.000
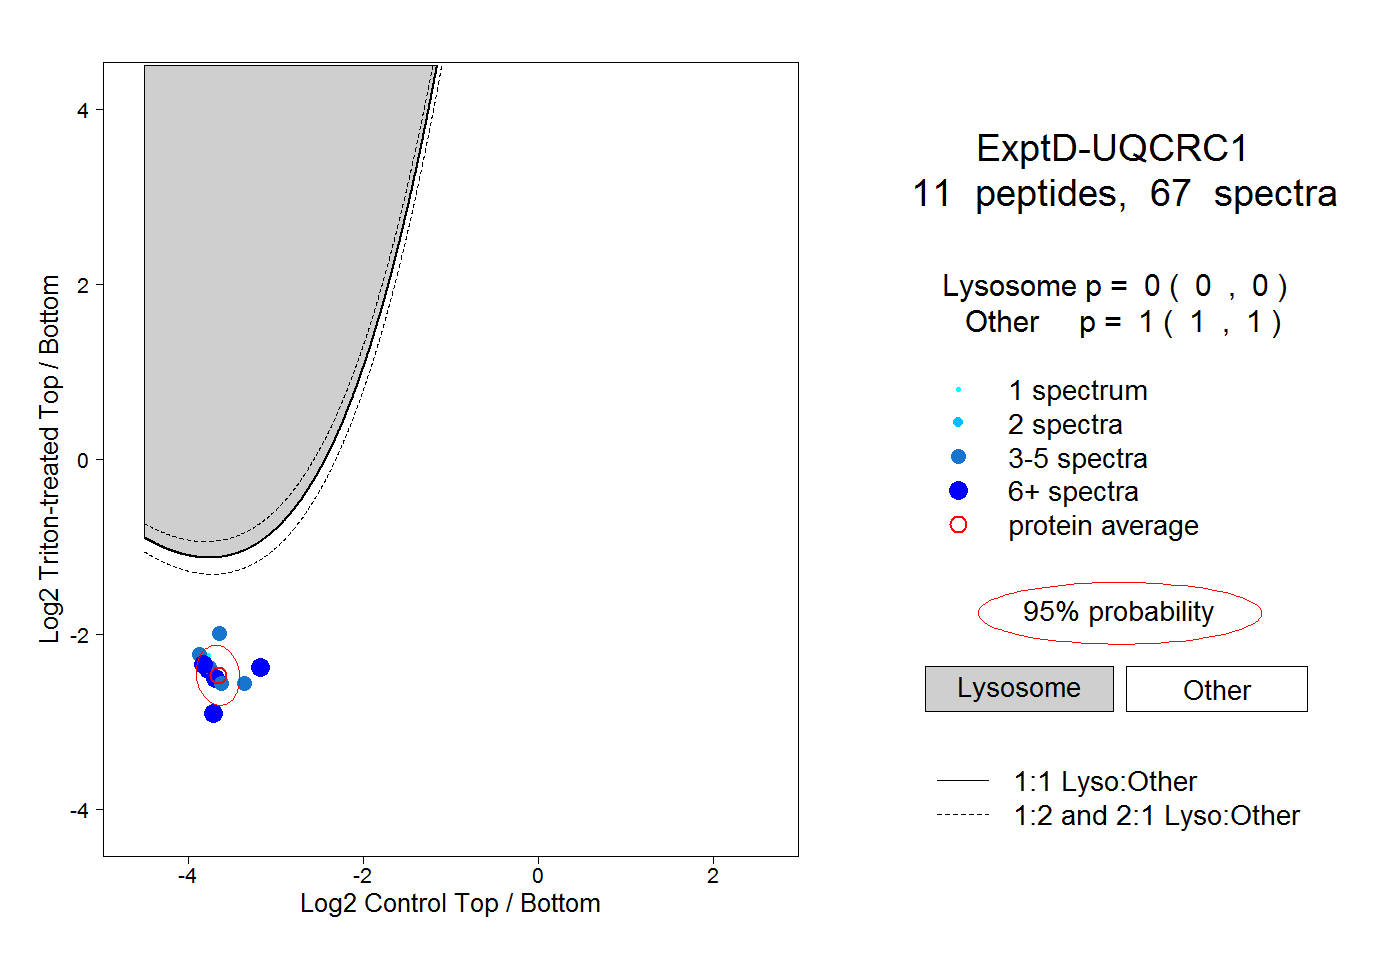
13peptides
spectra
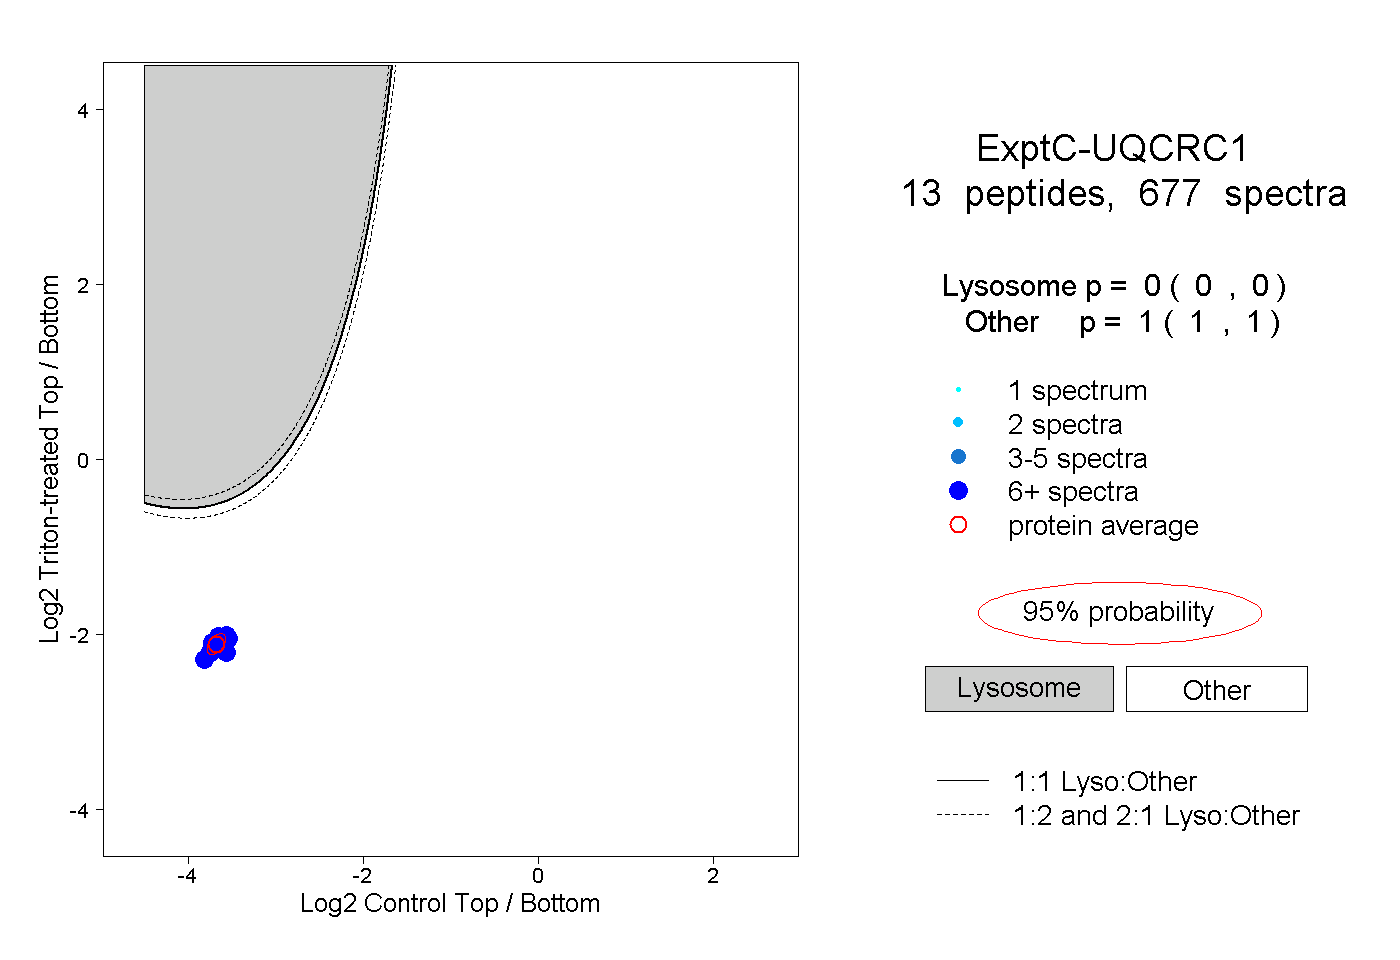
0.000 | 0.000
1.000 | 1.000