 13
13peptides
spectra
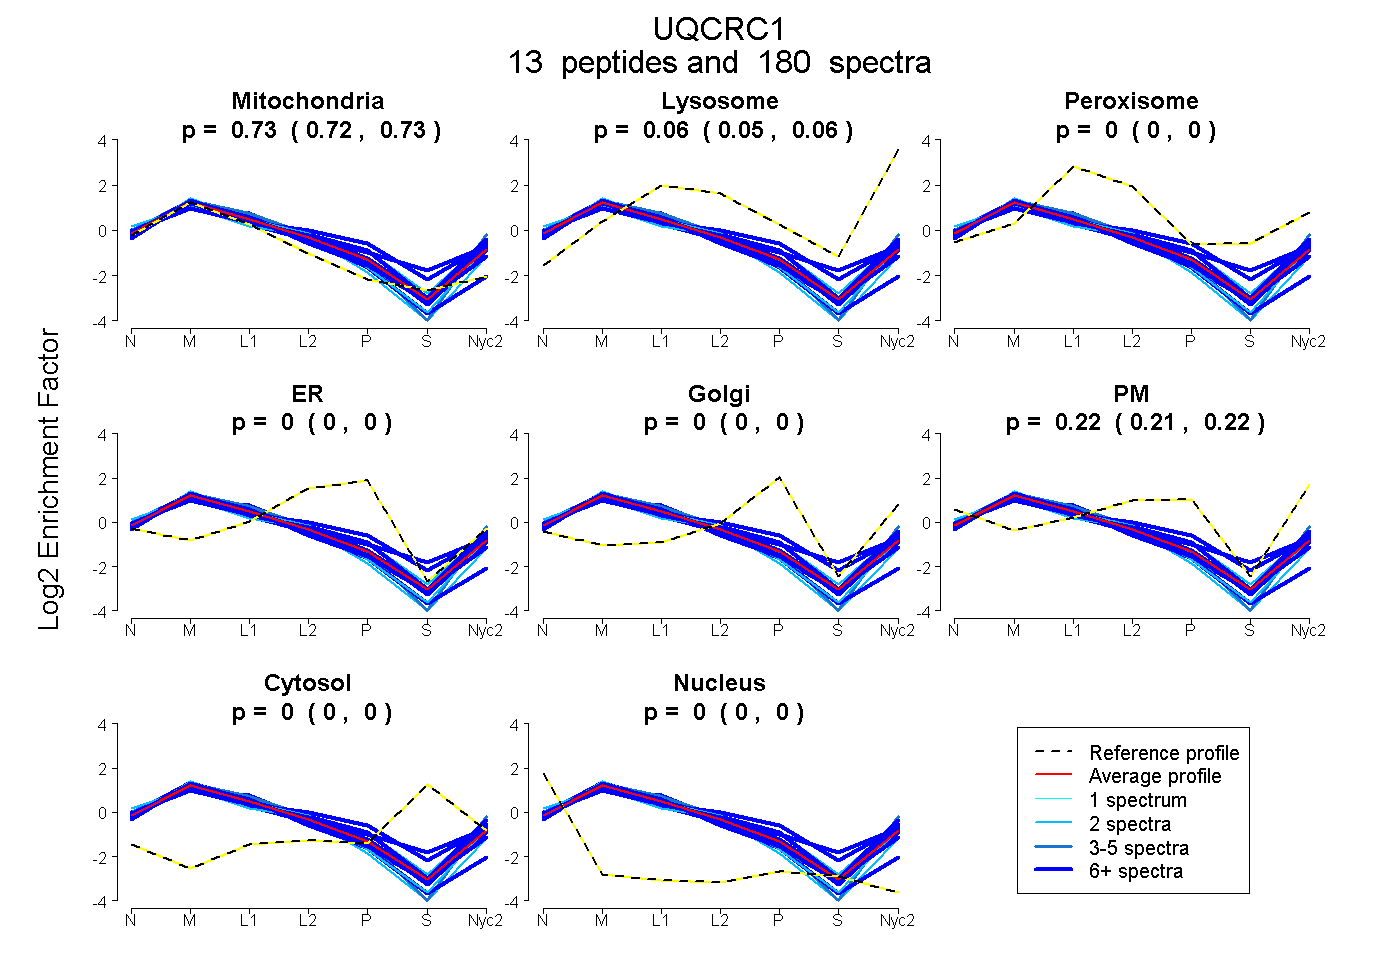
0.724 | 0.729
0.055 | 0.061
0.000 | 0.000
0.000 | 0.000
0.000 | 0.000
0.211 | 0.218
0.000 | 0.000
0.000 | 0.000
| Plot | Mito | Lyso | Perox | ER | Golgi | PM | Cytosol | Nucleus | |||||
| Expt A |
13 peptides |
180 spectra |
|
0.727 0.724 | 0.729 |
0.058 0.055 | 0.061 |
0.000 0.000 | 0.000 |
0.000 0.000 | 0.000 |
0.000 0.000 | 0.000 |
0.215 0.211 | 0.218 |
0.000 0.000 | 0.000 |
0.000 0.000 | 0.000 |
| 7 spectra, NALISHLDGTTPVCEDIGR | 0.558 | 0.020 | 0.091 | 0.090 | 0.036 | 0.205 | 0.000 | 0.000 | ||
| 2 spectra, MAASAVCR | 0.616 | 0.000 | 0.000 | 0.000 | 0.000 | 0.384 | 0.000 | 0.000 | ||
| 6 spectra, MVLAAAGGVK | 0.630 | 0.094 | 0.000 | 0.000 | 0.000 | 0.276 | 0.000 | 0.000 | ||
| 13 spectra, FTGSEIR | 0.774 | 0.047 | 0.000 | 0.000 | 0.000 | 0.179 | 0.000 | 0.000 | ||
| 23 spectra, SLLTYGR | 0.806 | 0.046 | 0.000 | 0.000 | 0.000 | 0.149 | 0.000 | 0.000 | ||
| 11 spectra, EVESIGAHLNAYSTR | 0.587 | 0.003 | 0.220 | 0.000 | 0.054 | 0.124 | 0.013 | 0.000 | ||
| 2 spectra, NNGAGYFLEHLAFK | 0.760 | 0.087 | 0.000 | 0.000 | 0.000 | 0.153 | 0.000 | 0.000 | ||
| 9 spectra, TDLTDYLSR | 0.684 | 0.074 | 0.000 | 0.000 | 0.000 | 0.242 | 0.000 | 0.000 | ||
| 57 spectra, SGMFWLR | 0.754 | 0.121 | 0.000 | 0.000 | 0.000 | 0.125 | 0.000 | 0.000 | ||
| 30 spectra, IEEVDAQMVR | 0.730 | 0.055 | 0.000 | 0.000 | 0.000 | 0.215 | 0.000 | 0.000 | ||
| 2 spectra, EHTAYLIK | 0.827 | 0.000 | 0.000 | 0.000 | 0.000 | 0.173 | 0.000 | 0.000 | ||
| 3 spectra, IPLAEWESR | 0.656 | 0.063 | 0.000 | 0.000 | 0.000 | 0.282 | 0.000 | 0.000 | ||
| 15 spectra, LCTSATESEVTR | 0.884 | 0.000 | 0.000 | 0.116 | 0.000 | 0.000 | 0.000 | 0.000 |
| Plot | Mito | Lyso or Perox | ER | Golgi | PM | Cytosol | Nucleus | ||||||
| Expt B |
13 peptides |
95 spectra |
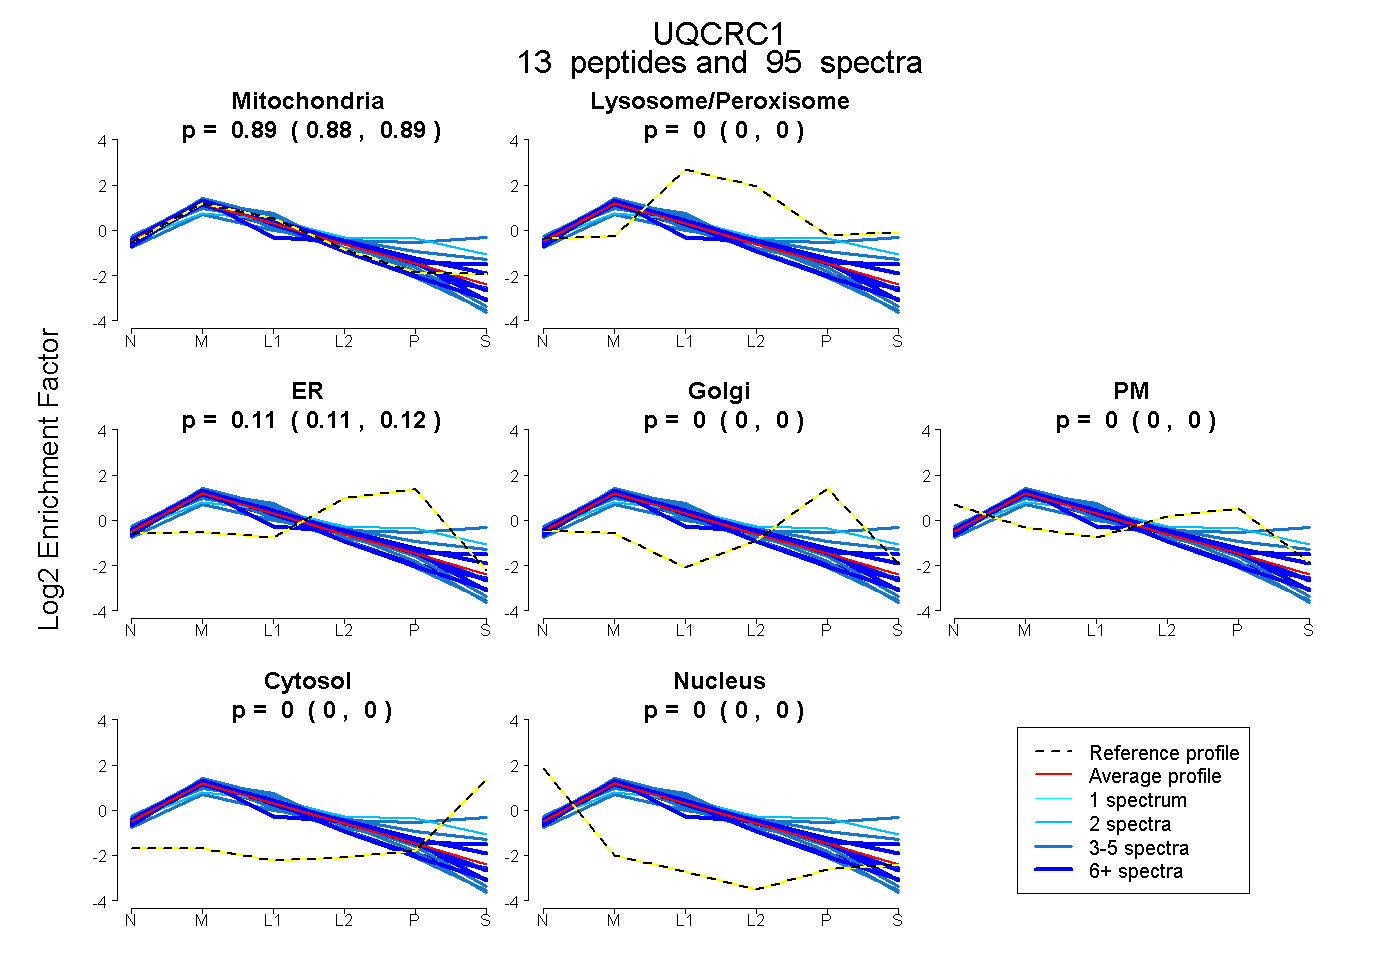 |
0.886 0.881 | 0.890 |
0.000 0.000 | 0.000 |
0.114 0.110 | 0.118 |
0.000 0.000 | 0.000 |
0.000 0.000 | 0.000 |
0.000 0.000 | 0.000 |
0.000 0.000 | 0.000 |
|||
| Plot | Lyso | Other | |||||||||||
| Expt C |
13 peptides |
677 spectra |
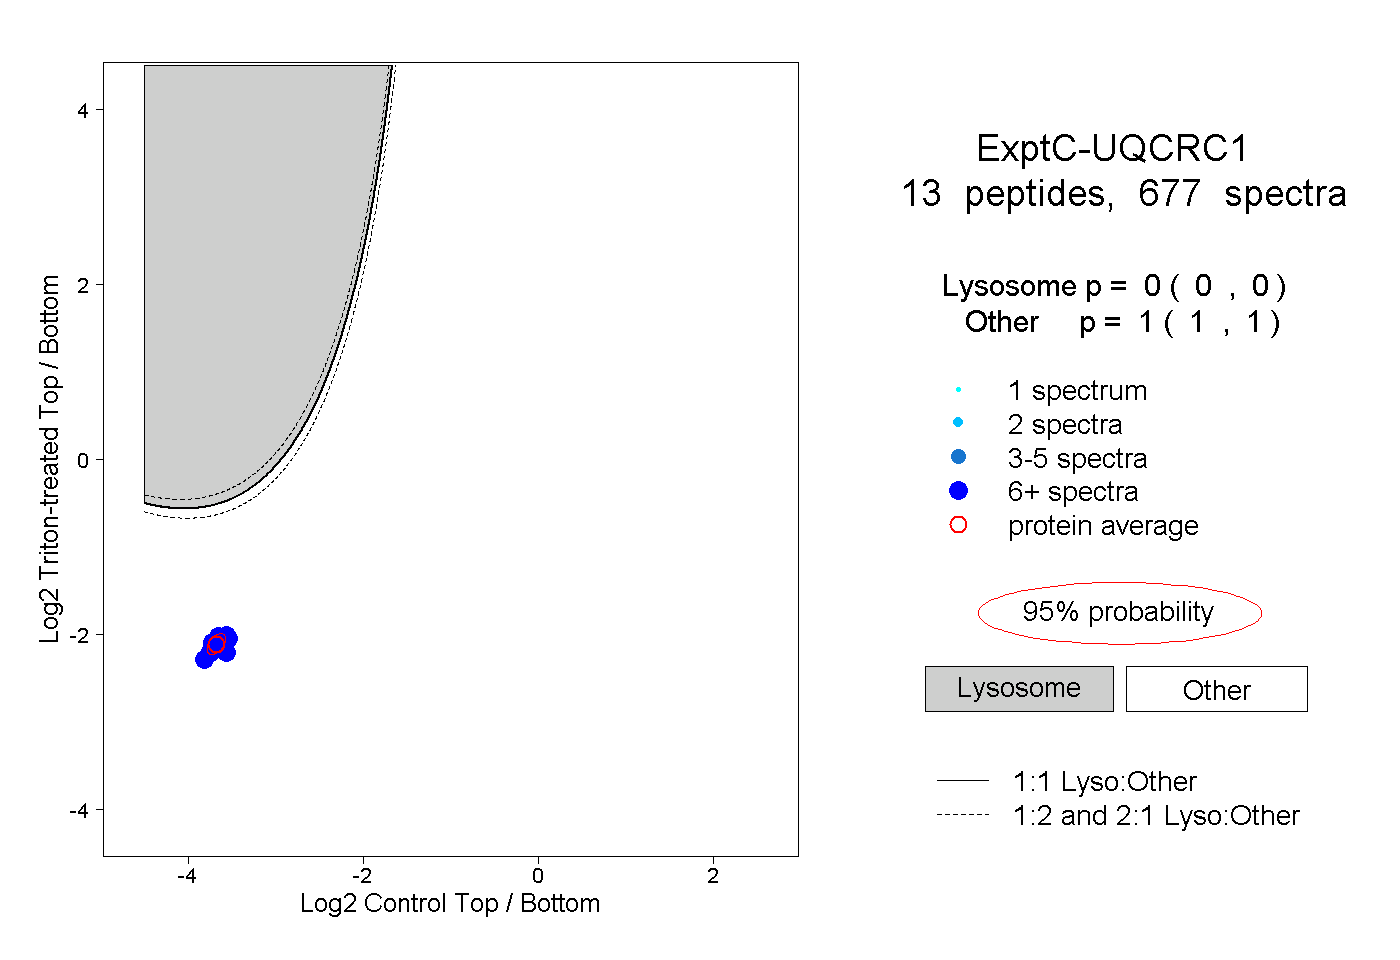 |
0.000 0.000 | 0.000 |
1.000 1.000 | 1.000 |
||||||||
| Plot | Lyso | Other | |||||||||||
| Expt D |
11 peptides |
67 spectra |
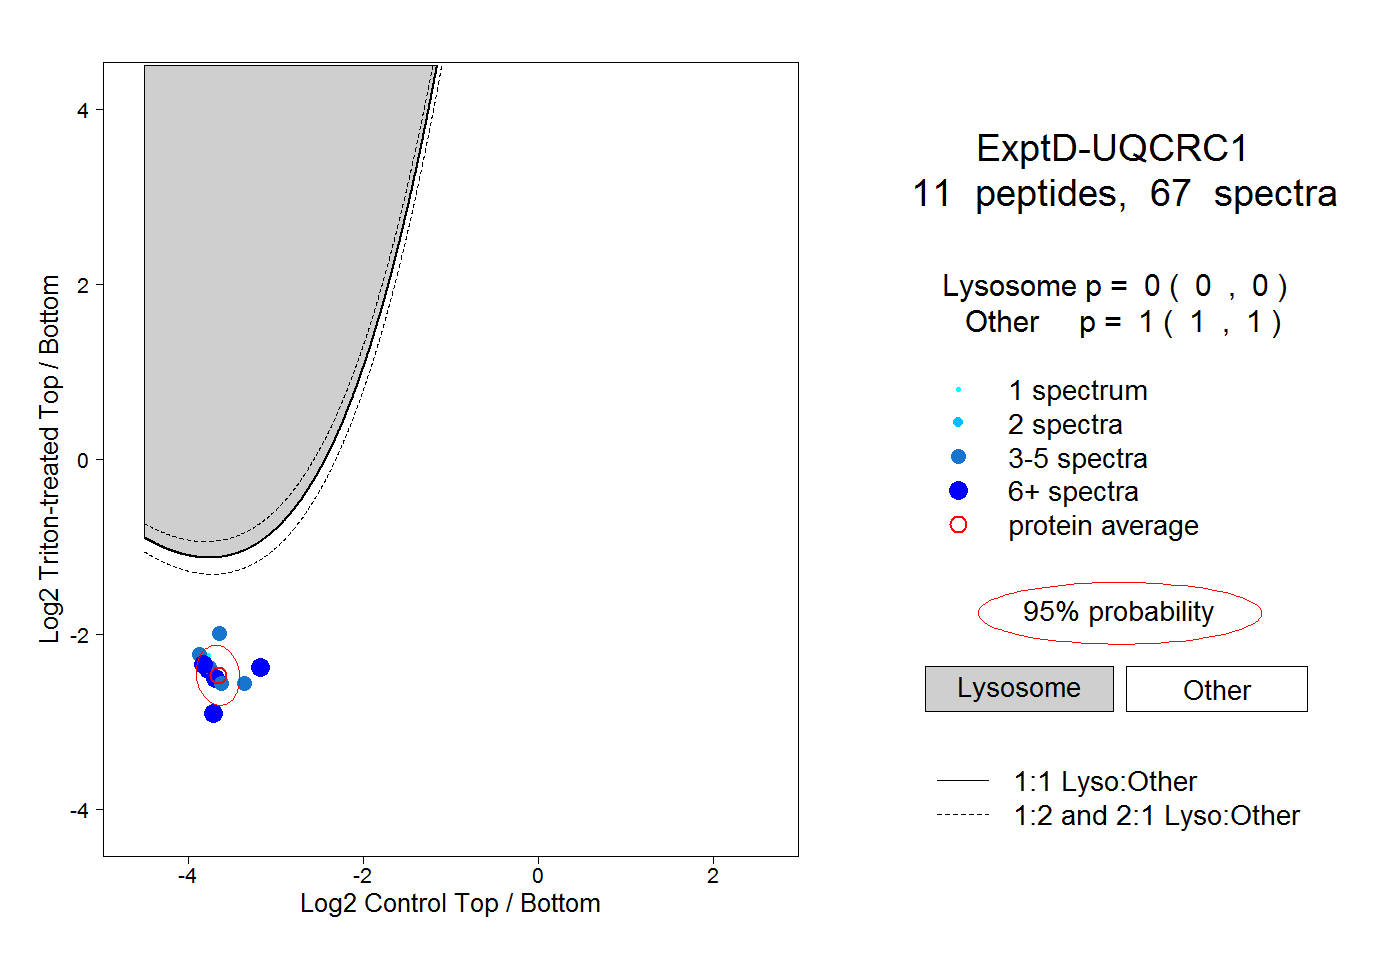 |
0.000 0.000 | 0.000 |
1.000 1.000 | 1.000 |