 9
9peptides
spectra
0.000 | 0.000
0.000 | 0.029
0.000 | 0.000
0.000 | 0.000
0.000 | 0.032
0.180 | 0.229
0.756 | 0.781
0.000 | 0.000
7peptides
spectra
0.000 | 0.000
1.000 | 1.000
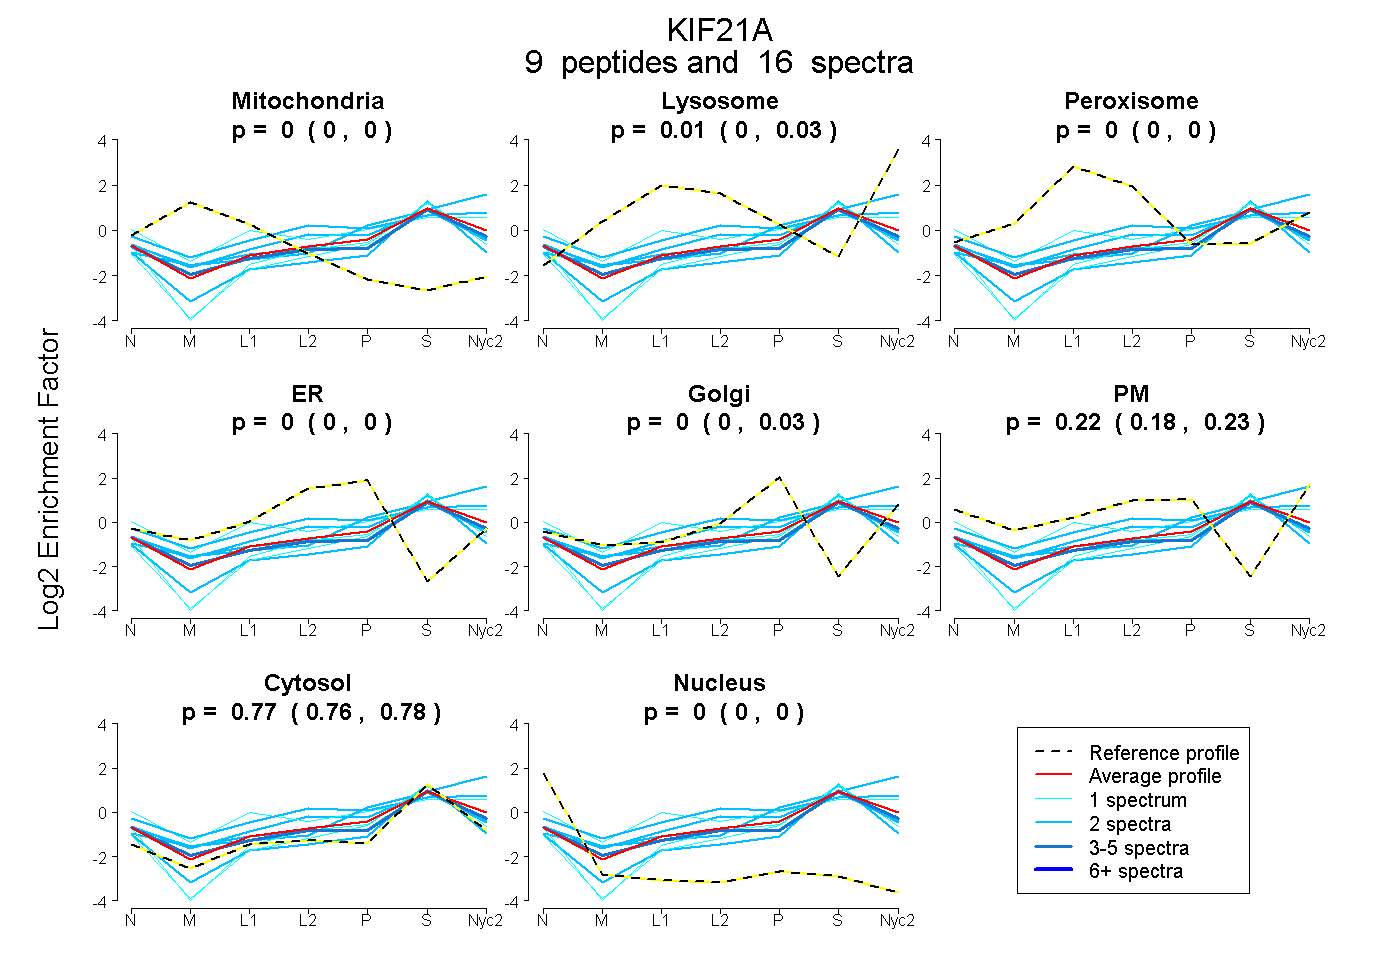
| Plot | Mito | Lyso | Perox | ER | Golgi | PM | Cytosol | Nucleus | |||||
| Expt A |
9 peptides |
16 spectra |
|
0.000 0.000 | 0.000 |
0.008 0.000 | 0.029 |
0.000 0.000 | 0.000 |
0.000 0.000 | 0.000 |
0.000 0.000 | 0.032 |
0.222 0.180 | 0.229 |
0.771 0.756 | 0.781 |
0.000 0.000 | 0.000 |
||
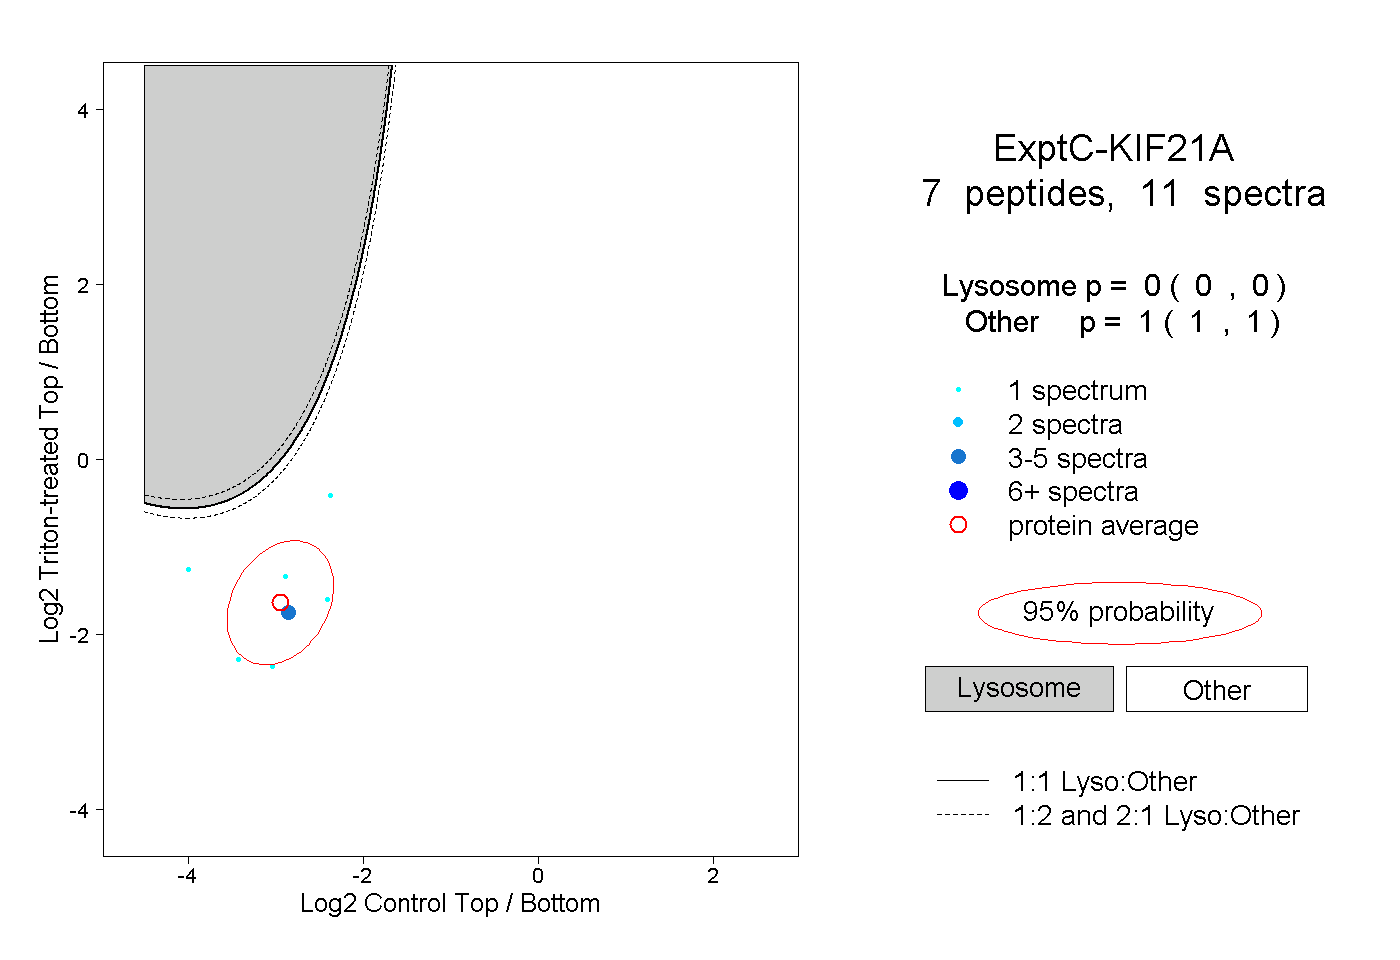
| Plot | Lyso | Other | |||||||||||
| Expt C |
7 peptides |
11 spectra |
|
0.000 0.000 | 0.000 |
1.000 1.000 | 1.000 |
| 1 spectrum, HGEISFLQR | 0.000 | 1.000 | ||||||||
| 1 spectrum, LTESR | 0.000 | 1.000 | ||||||||
| 1 spectrum, IQTLK | 0.000 | 1.000 | ||||||||
| 5 spectra, CEYEK | 0.000 | 1.000 | ||||||||
| 1 spectrum, VCPQTDAENVTDNK | 0.000 | 1.000 | ||||||||
| 1 spectrum, LQTAQK | 0.000 | 1.000 | ||||||||
| 1 spectrum, NQEVVLR | 0.000 | 1.000 |