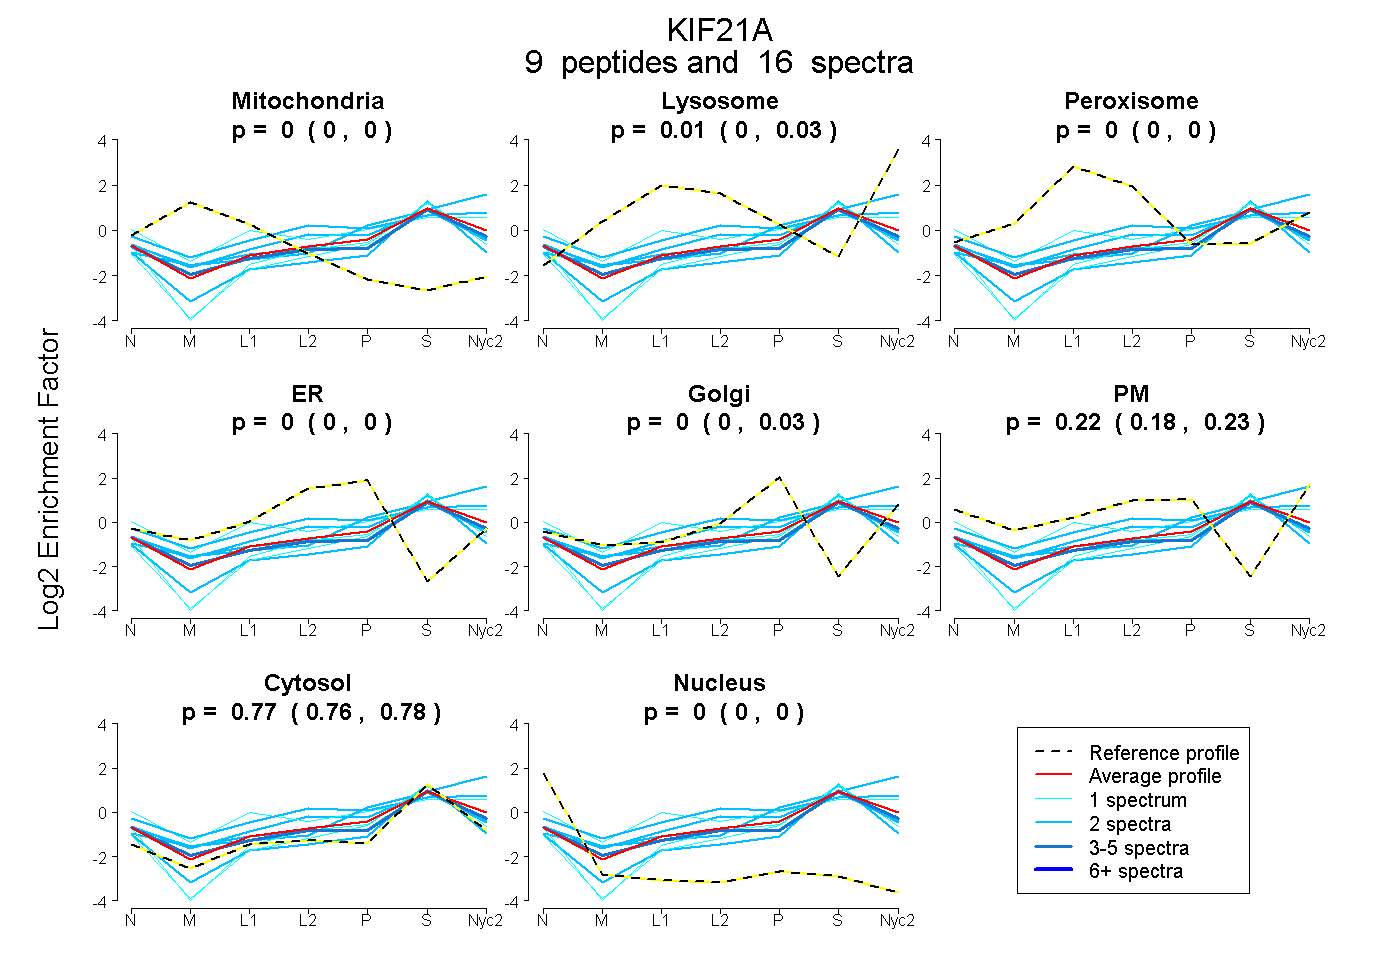
 9
9peptides
spectra
0.000 | 0.000
0.000 | 0.029
0.000 | 0.000
0.000 | 0.000
0.000 | 0.032
0.180 | 0.229
0.756 | 0.781
0.000 | 0.000
| Plot | Mito | Lyso | Perox | ER | Golgi | PM | Cytosol | Nucleus | |||||
| Expt A |
9 peptides |
16 spectra |
|
0.000 0.000 | 0.000 |
0.008 0.000 | 0.029 |
0.000 0.000 | 0.000 |
0.000 0.000 | 0.000 |
0.000 0.000 | 0.032 |
0.222 0.180 | 0.229 |
0.771 0.756 | 0.781 |
0.000 0.000 | 0.000 |
| 3 spectra, TTASTQMNVQSSR | 0.000 | 0.000 | 0.000 | 0.000 | 0.000 | 0.189 | 0.811 | 0.000 | ||
| 1 spectrum, IRPQLAK | 0.000 | 0.000 | 0.000 | 0.000 | 0.040 | 0.000 | 0.959 | 0.001 | ||
| 2 spectra, LLESEAVNENLR | 0.018 | 0.000 | 0.055 | 0.000 | 0.000 | 0.149 | 0.778 | 0.000 | ||
| 2 spectra, ASFLQCVHVAEGHTK | 0.000 | 0.280 | 0.000 | 0.000 | 0.000 | 0.124 | 0.596 | 0.000 | ||
| 1 spectrum, IAGLSR | 0.000 | 0.015 | 0.141 | 0.000 | 0.000 | 0.324 | 0.520 | 0.000 | ||
| 1 spectrum, TEEVTALR | 0.000 | 0.000 | 0.000 | 0.000 | 0.093 | 0.000 | 0.907 | 0.000 | ||
| 2 spectra, LMMLQHK | 0.000 | 0.000 | 0.010 | 0.000 | 0.292 | 0.000 | 0.698 | 0.000 | ||
| 2 spectra, ASQQINALR | 0.000 | 0.000 | 0.000 | 0.000 | 0.000 | 0.000 | 0.946 | 0.054 | ||
| 2 spectra, NQSQYEK | 0.000 | 0.132 | 0.053 | 0.000 | 0.000 | 0.297 | 0.519 | 0.000 |
| Plot | Lyso | Other | |||||||||||
| Expt C |
7 peptides |
11 spectra |
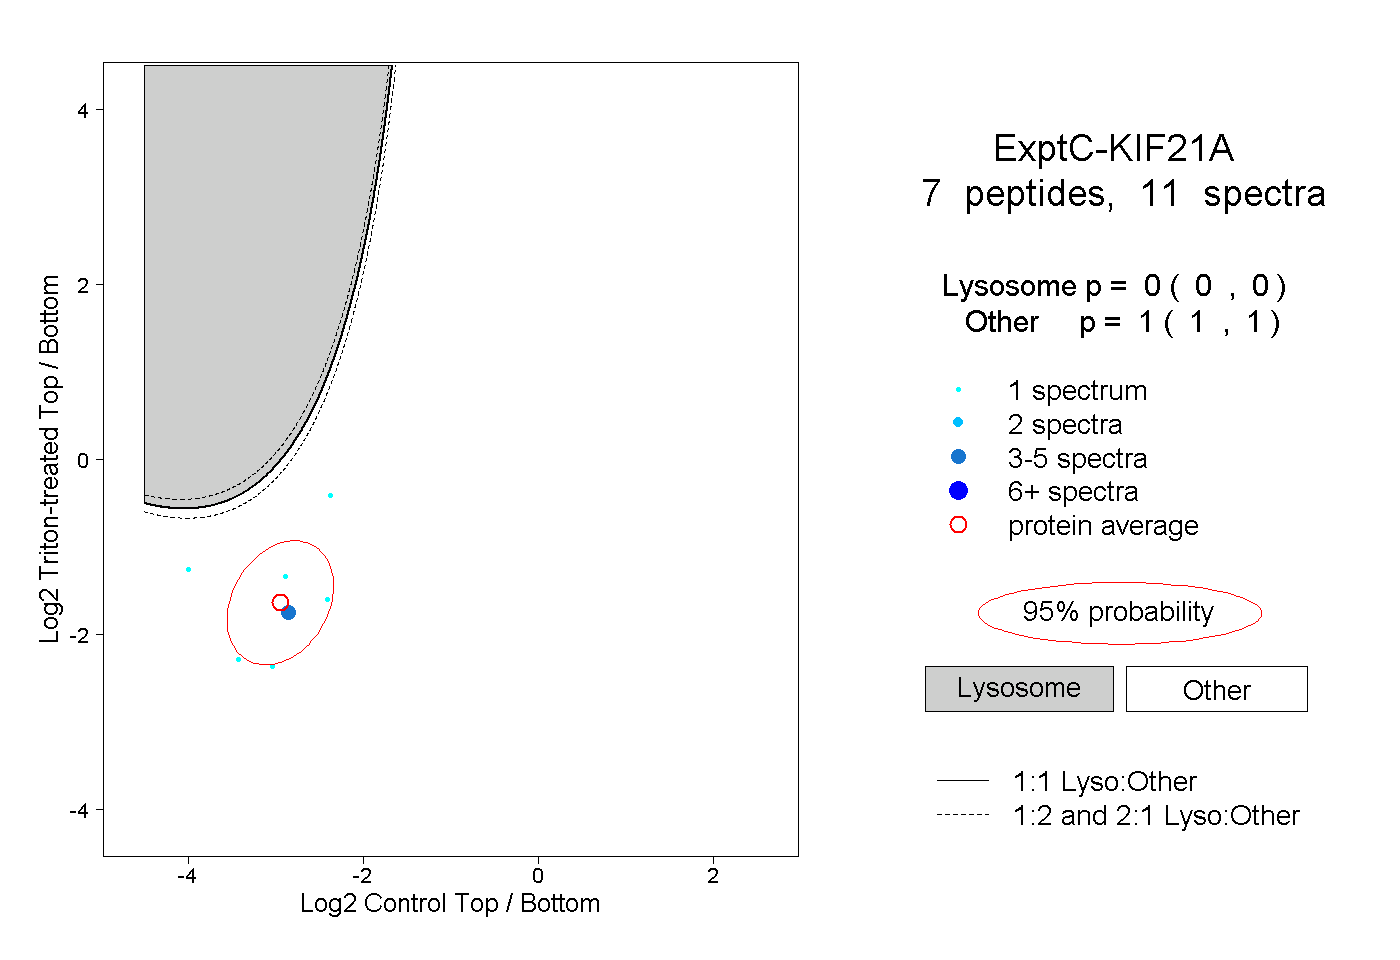 |
0.000 0.000 | 0.000 |
1.000 1.000 | 1.000 |