 4
4peptides
spectra
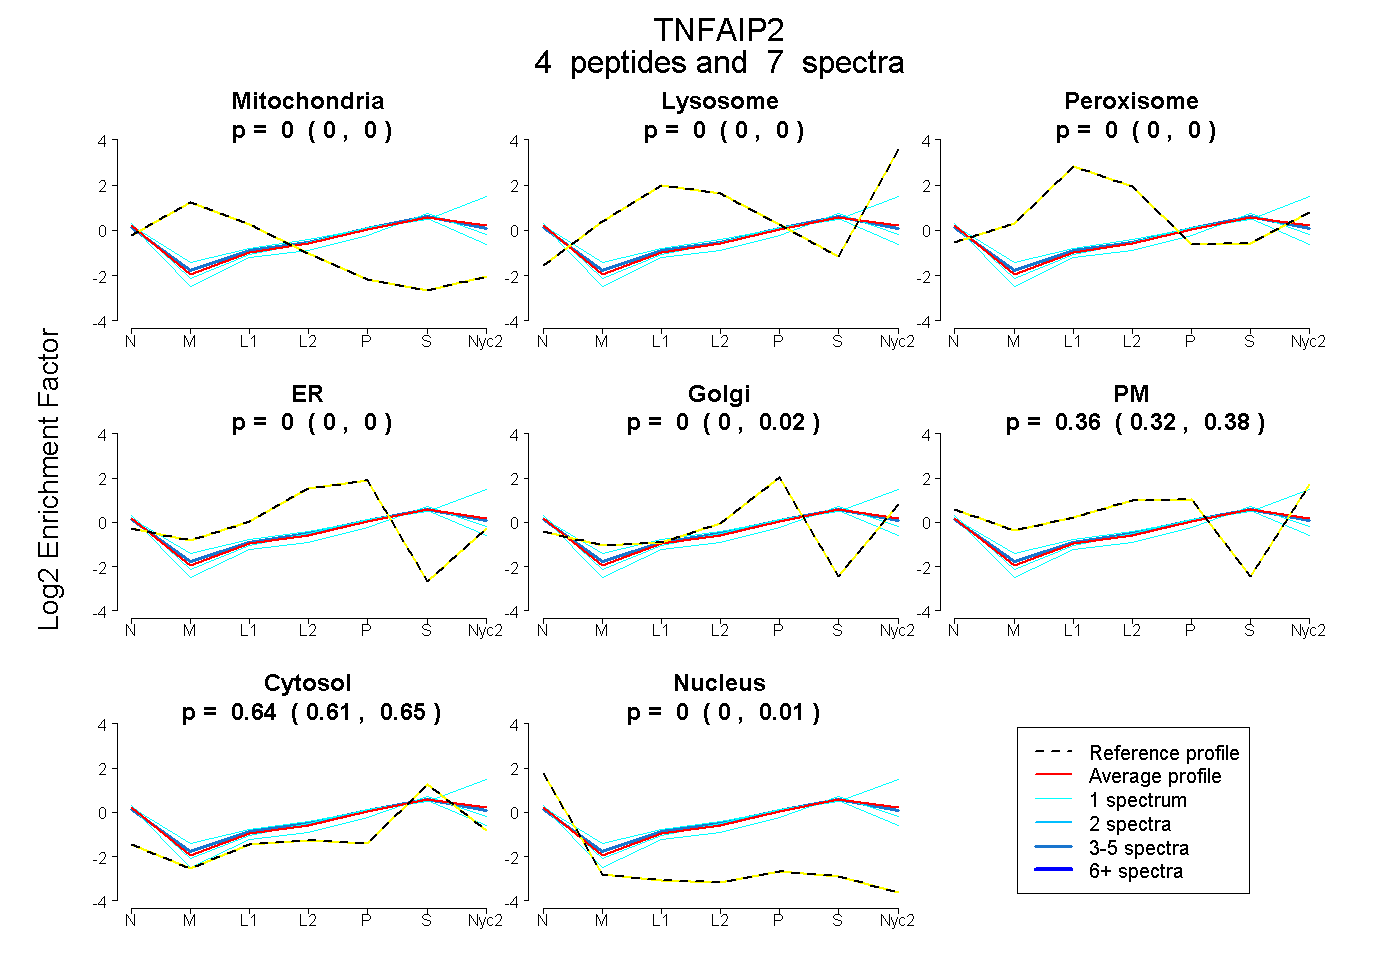
0.000 | 0.000
0.000 | 0.000
0.000 | 0.000
0.000 | 0.000
0.000 | 0.018
0.323 | 0.382
0.613 | 0.649
0.000 | 0.010
| Plot | Mito | Lyso | Perox | ER | Golgi | PM | Cytosol | Nucleus | |||||
| Expt A |
4 peptides |
7 spectra |
|
0.000 0.000 | 0.000 |
0.000 0.000 | 0.000 |
0.000 0.000 | 0.000 |
0.000 0.000 | 0.000 |
0.000 0.000 | 0.018 |
0.363 0.323 | 0.382 |
0.637 0.613 | 0.649 |
0.000 0.000 | 0.010 |
| 1 spectrum, GHLNAILAIK | 0.000 | 0.000 | 0.000 | 0.139 | 0.000 | 0.188 | 0.620 | 0.052 | ||
| 4 spectra, FLHMGR | 0.000 | 0.000 | 0.000 | 0.000 | 0.000 | 0.371 | 0.629 | 0.000 | ||
| 1 spectrum, VFDEFLEK | 0.000 | 0.000 | 0.000 | 0.000 | 0.019 | 0.241 | 0.696 | 0.044 | ||
| 1 spectrum, LAQELQGIR | 0.000 | 0.100 | 0.000 | 0.000 | 0.000 | 0.396 | 0.504 | 0.000 |
| Plot | Mito | Lyso or Perox | ER | Golgi | PM | Cytosol | Nucleus | ||||||
| Expt B |
2 peptides |
2 spectra |
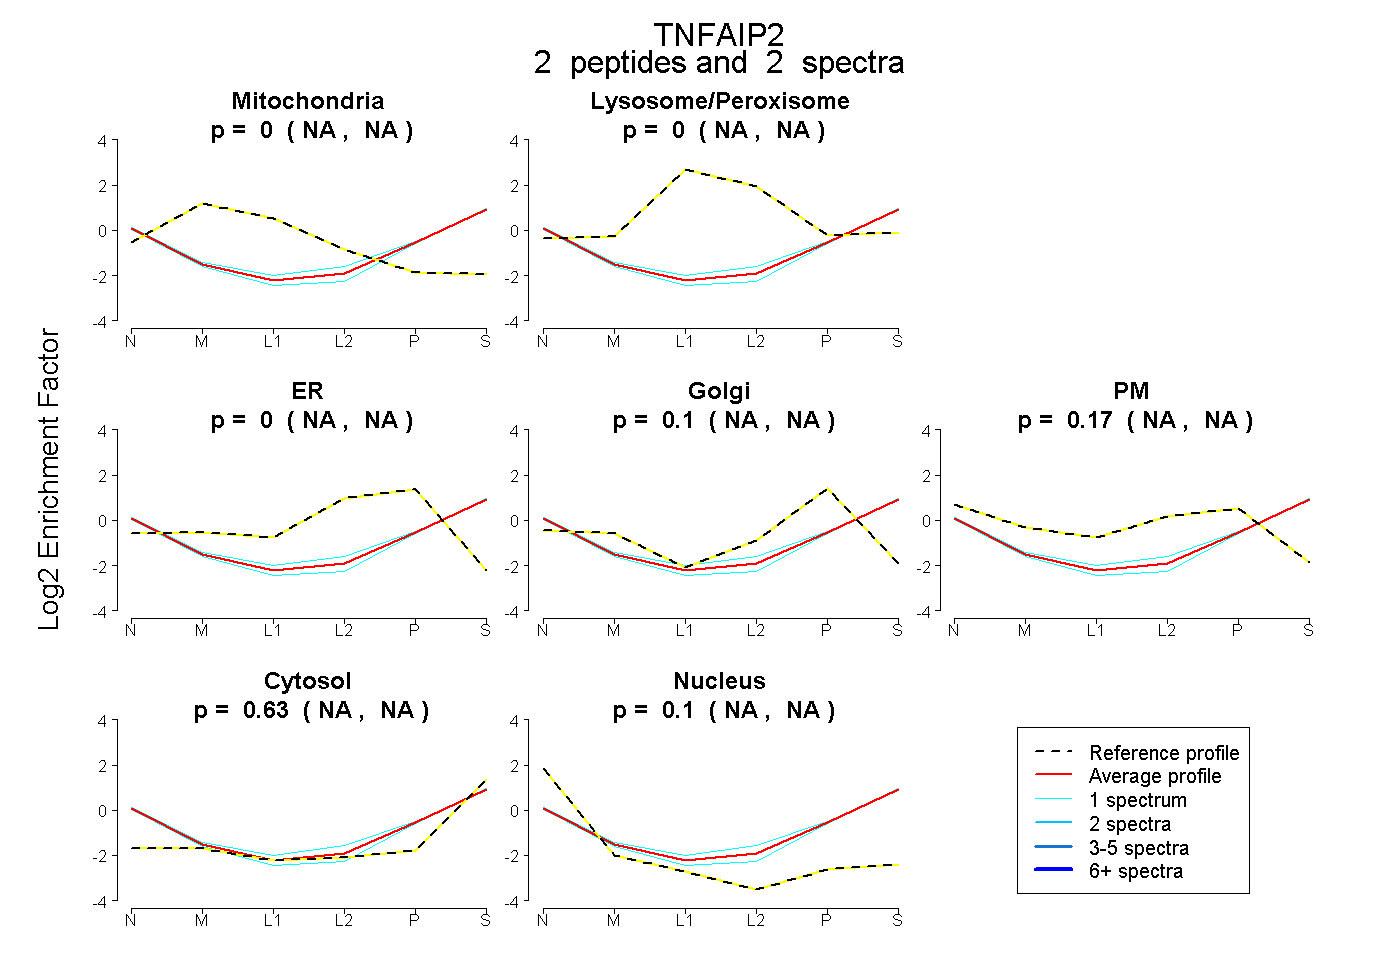 |
0.000 NA | NA |
0.000 NA | NA |
0.000 NA | NA |
0.099 NA | NA |
0.169 NA | NA |
0.629 NA | NA |
0.103 NA | NA |
|||
| Plot | Lyso | Other | |||||||||||
| Expt C |
1 peptide |
1 spectrum |
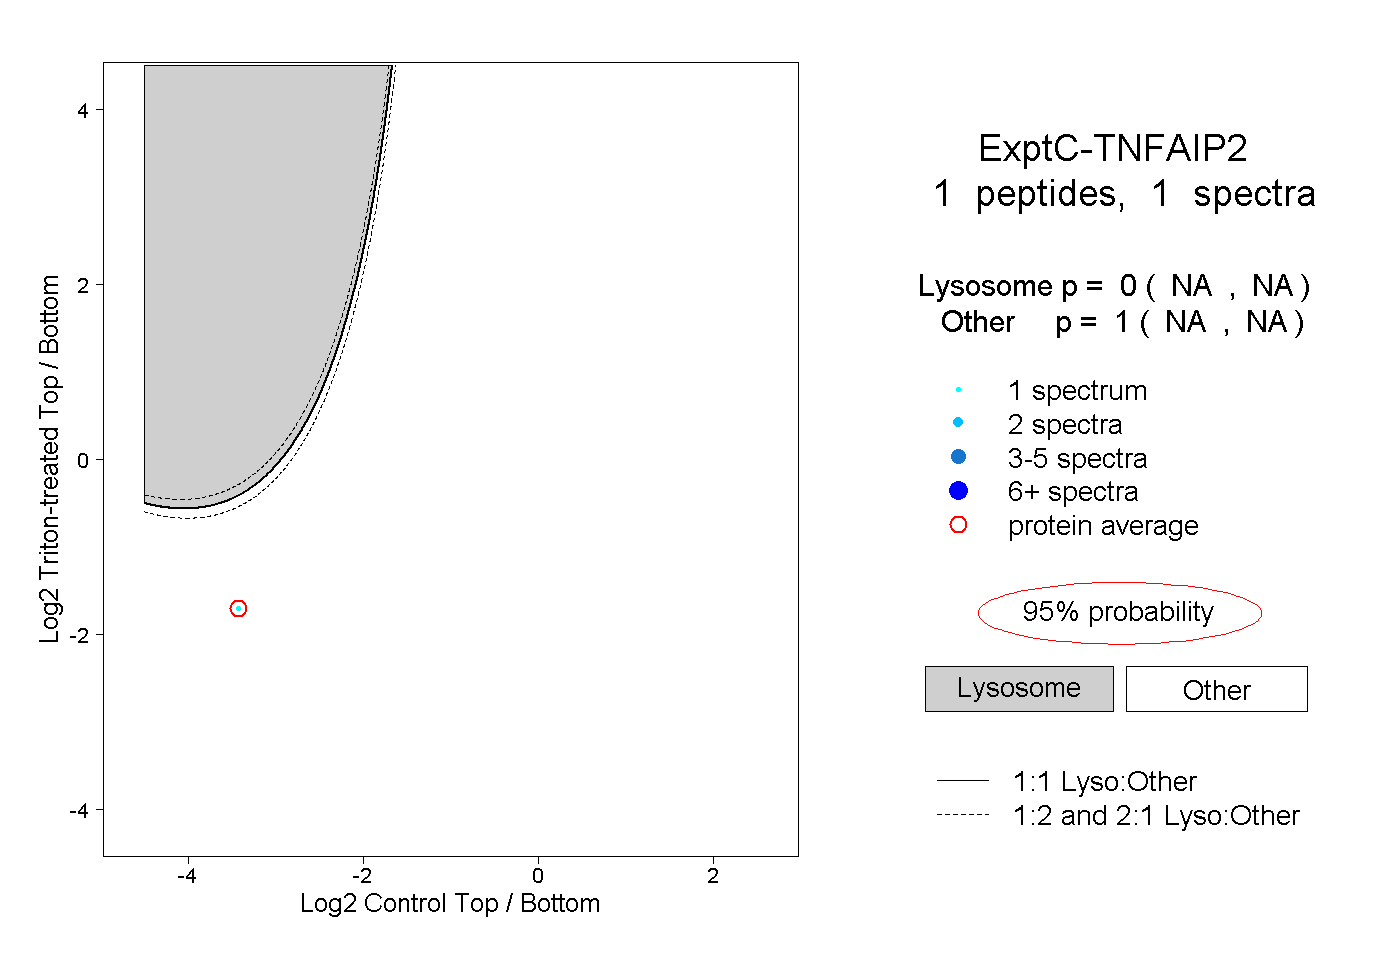 |
0.000 NA | NA |
1.000 NA | NA |