 3
3peptides
spectra
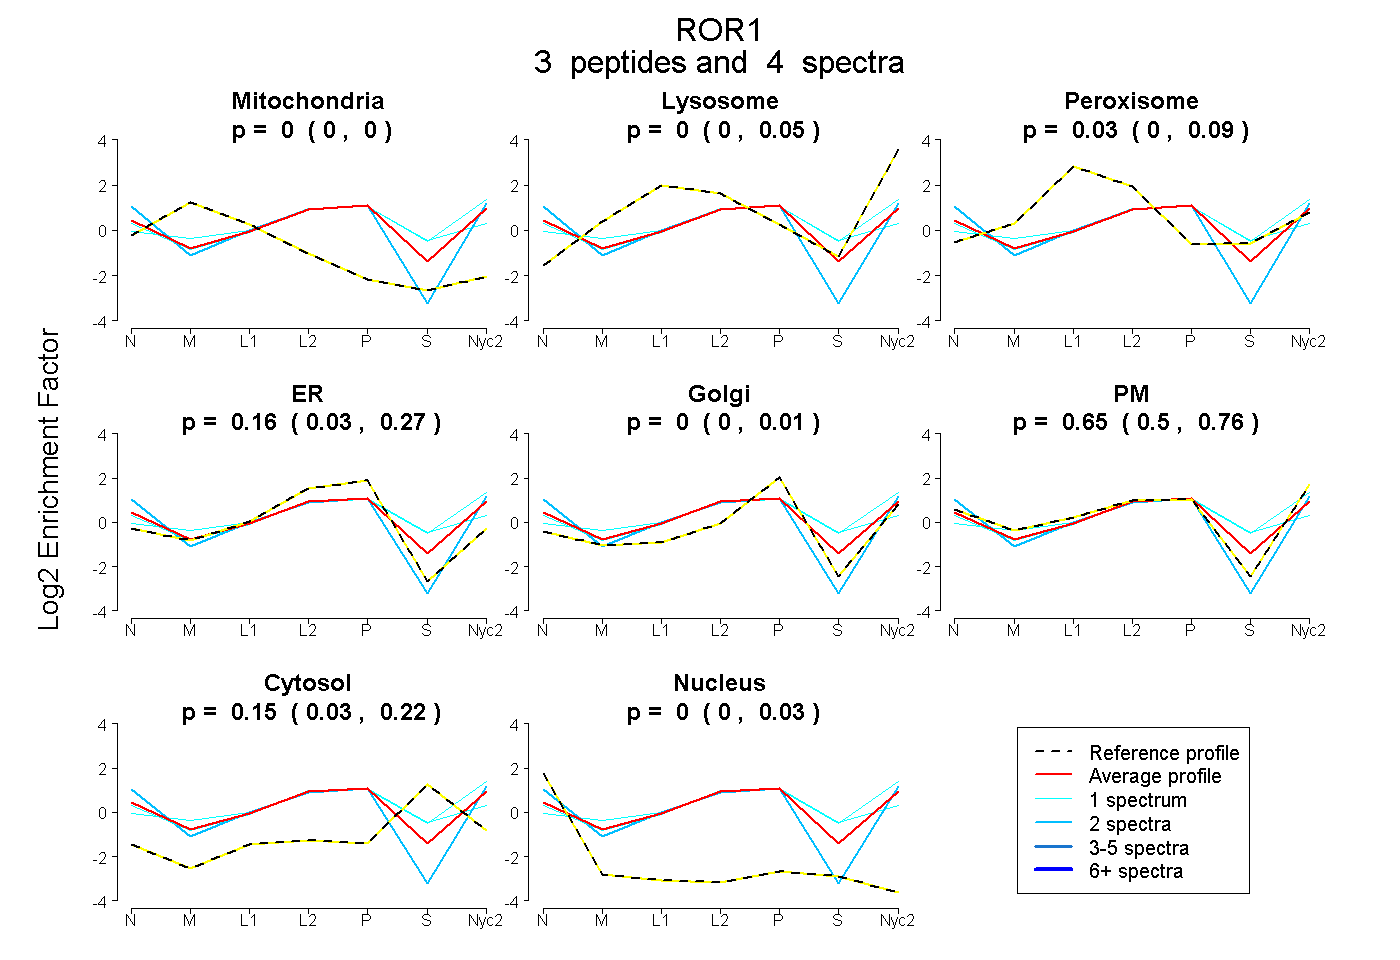
0.000 | 0.000
0.000 | 0.047
0.000 | 0.089
0.029 | 0.269
0.000 | 0.012
0.498 | 0.764
0.032 | 0.221
0.000 | 0.031
| Plot | Mito | Lyso | Perox | ER | Golgi | PM | Cytosol | Nucleus | |||||
| Expt A |
3 peptides |
4 spectra |
|
0.000 0.000 | 0.000 |
0.000 0.000 | 0.047 |
0.031 0.000 | 0.089 |
0.162 0.029 | 0.269 |
0.000 0.000 | 0.012 |
0.652 0.498 | 0.764 |
0.154 0.032 | 0.221 |
0.000 0.000 | 0.031 |
| 2 spectra, SPSPPVQR | 0.000 | 0.000 | 0.000 | 0.119 | 0.000 | 0.808 | 0.000 | 0.073 | ||
| 1 spectrum, VSGNPPPNIR | 0.000 | 0.098 | 0.026 | 0.018 | 0.000 | 0.626 | 0.232 | 0.000 | ||
| 1 spectrum, FMEELGECTFGK | 0.000 | 0.000 | 0.231 | 0.245 | 0.135 | 0.180 | 0.209 | 0.000 |
| Plot | Lyso | Other | |||||||||||
| Expt C |
3 peptides |
5 spectra |
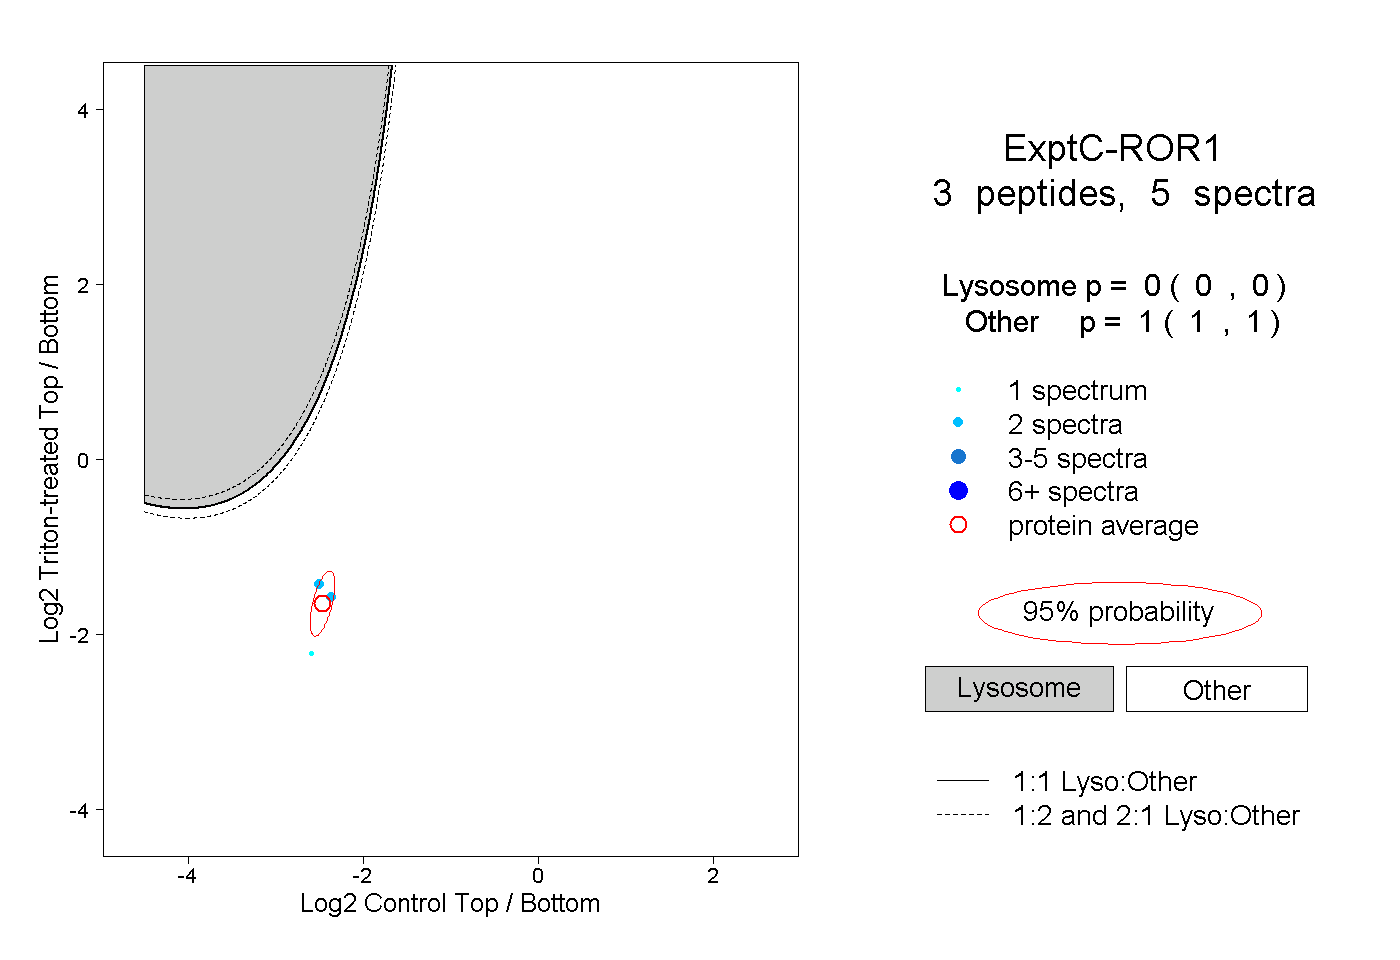 |
0.000 0.000 | 0.000 |
1.000 1.000 | 1.000 |