 4
4peptides
spectra
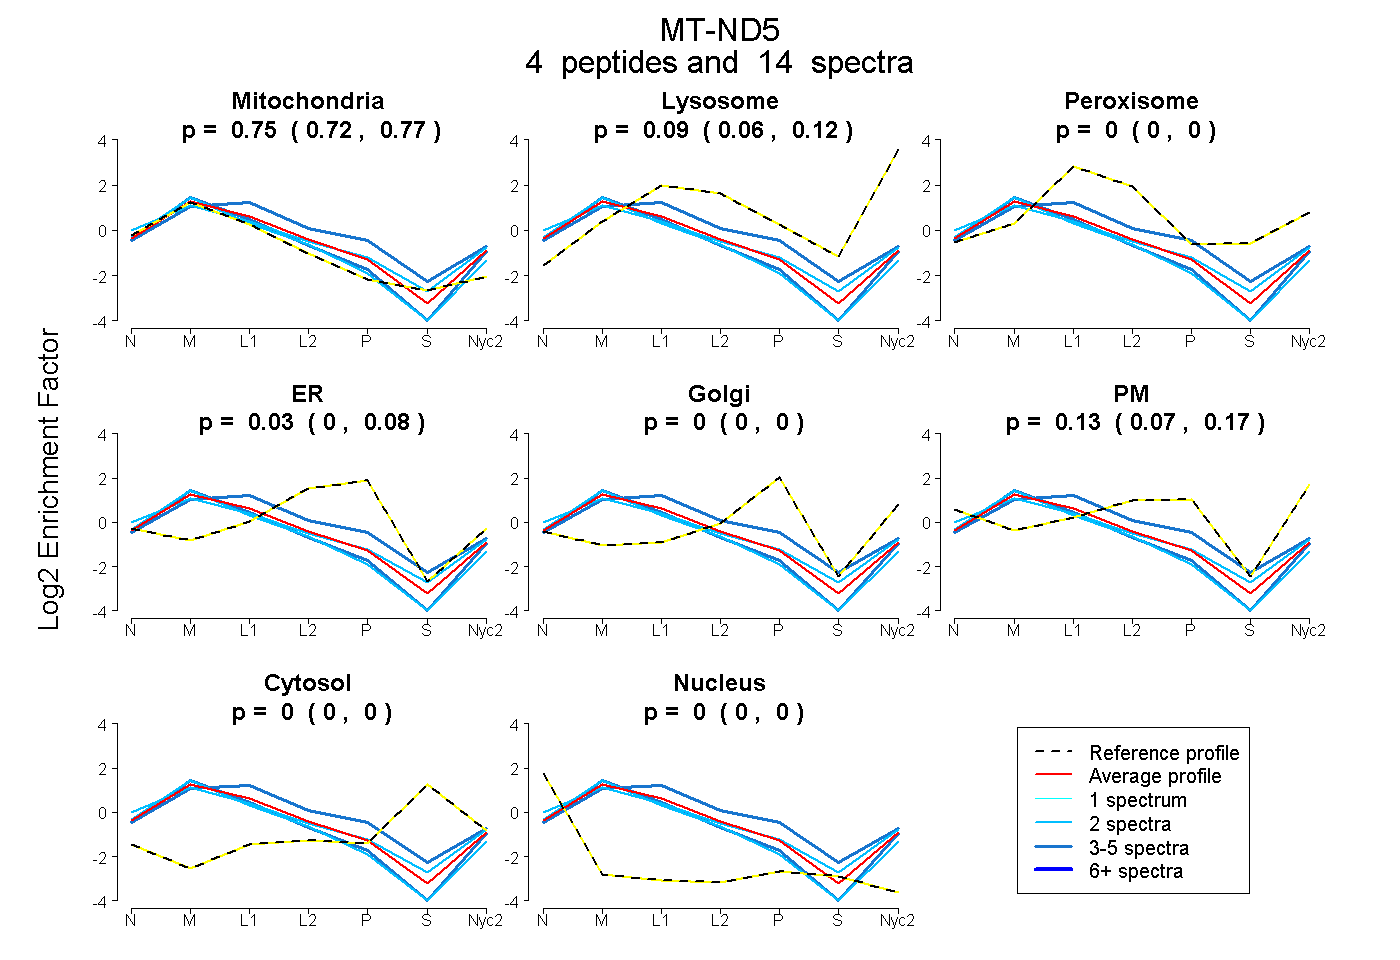
0.719 | 0.773
0.060 | 0.124
0.000 | 0.000
0.000 | 0.077
0.000 | 0.000
0.066 | 0.171
0.000 | 0.000
0.000 | 0.000
4peptides
spectra
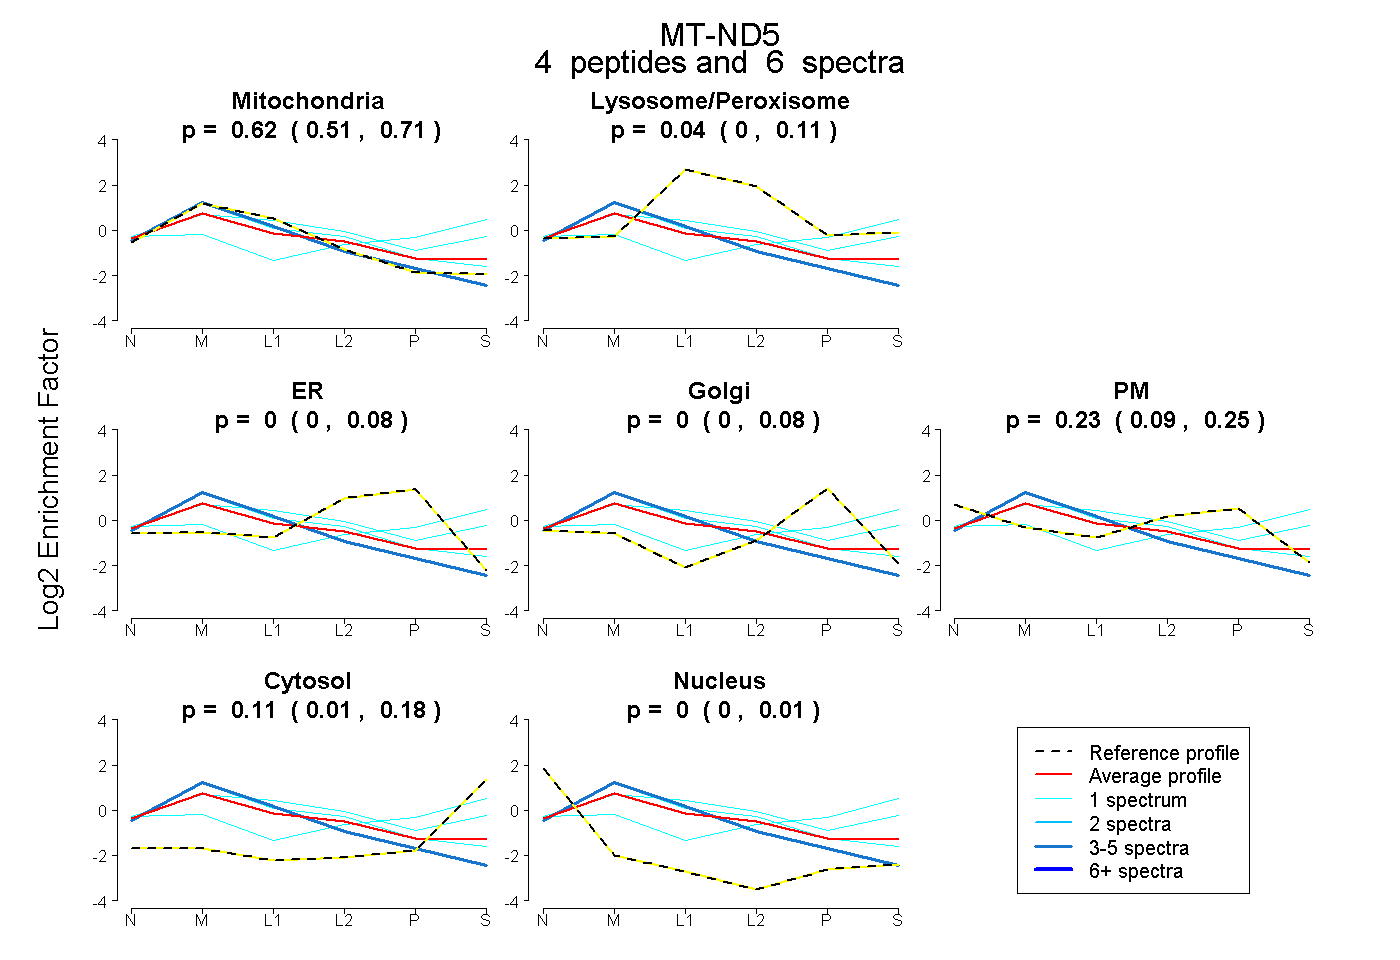
0.508 | 0.708
0.000 | 0.109
0.000 | 0.082
0.000 | 0.084
0.088 | 0.253
0.012 | 0.183
0.000 | 0.013
6peptides
spectra
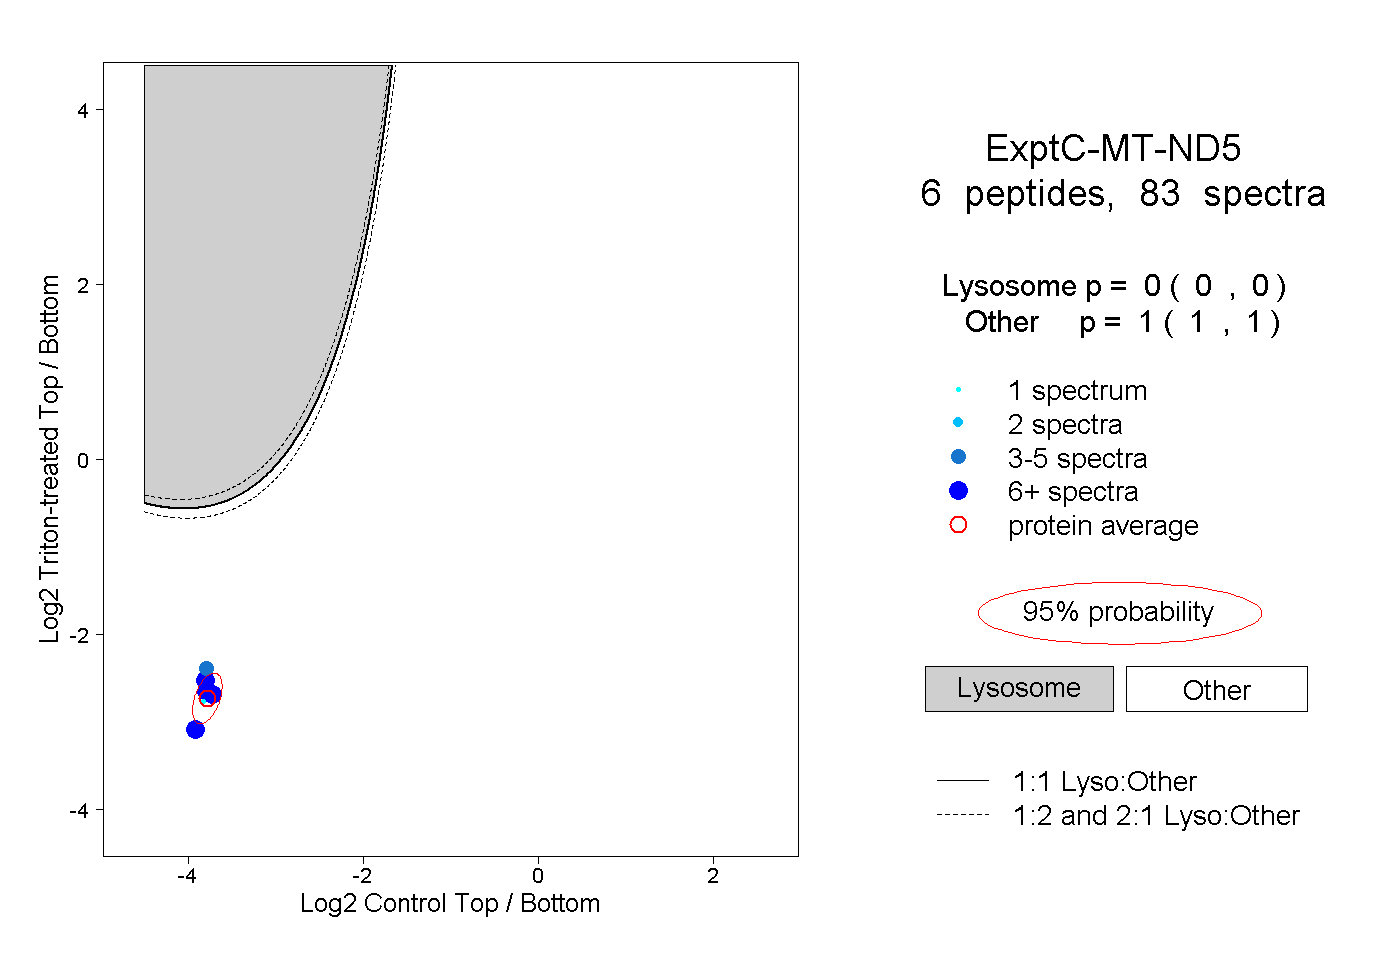
0.000 | 0.000
1.000 | 1.000
1peptide
spectra
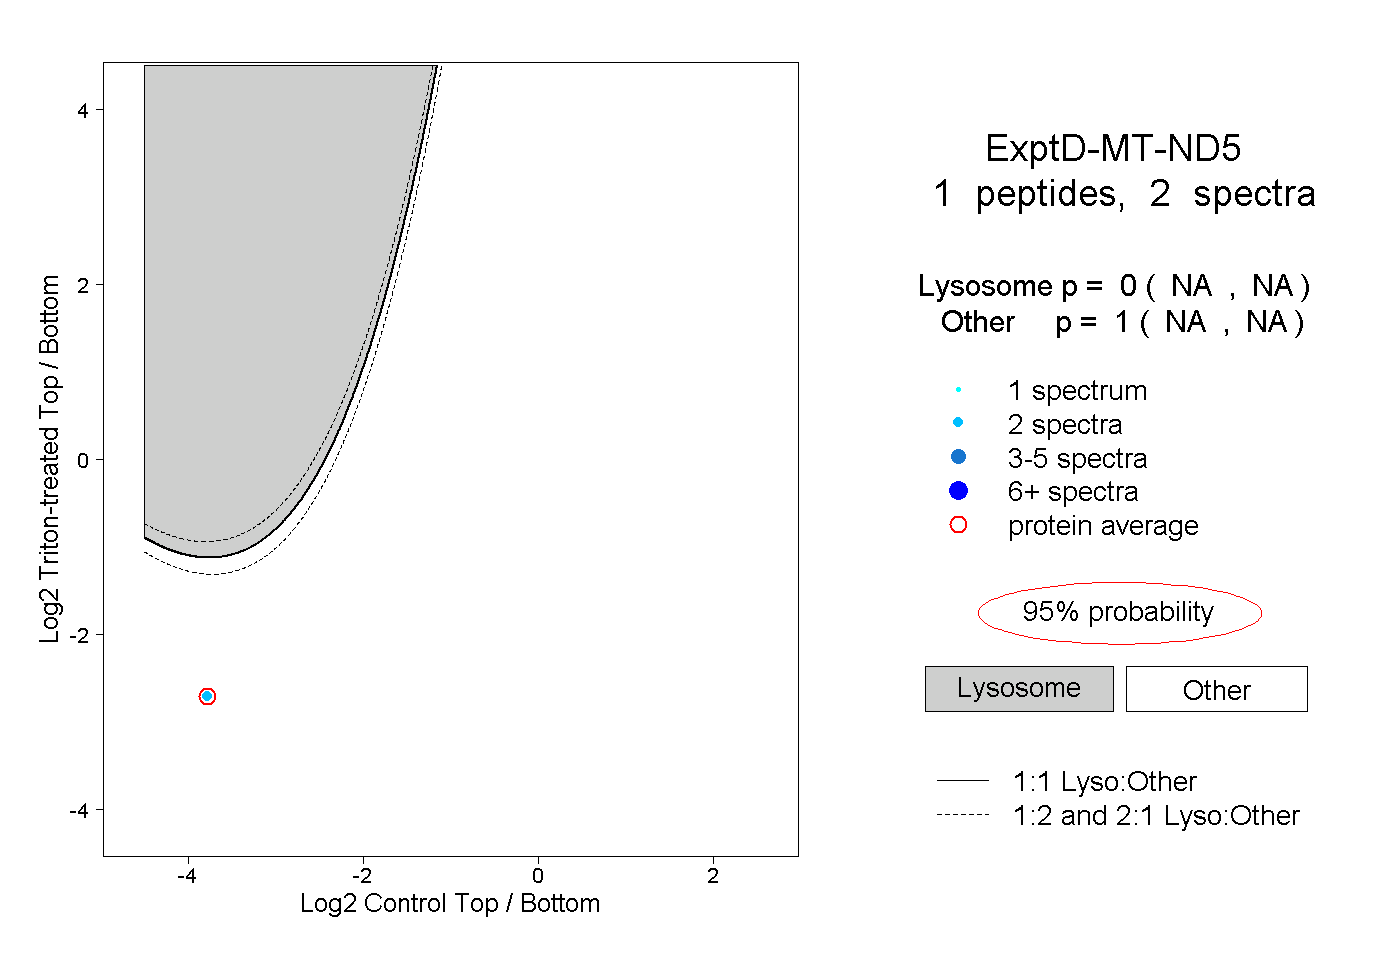
NA | NA
NA | NA