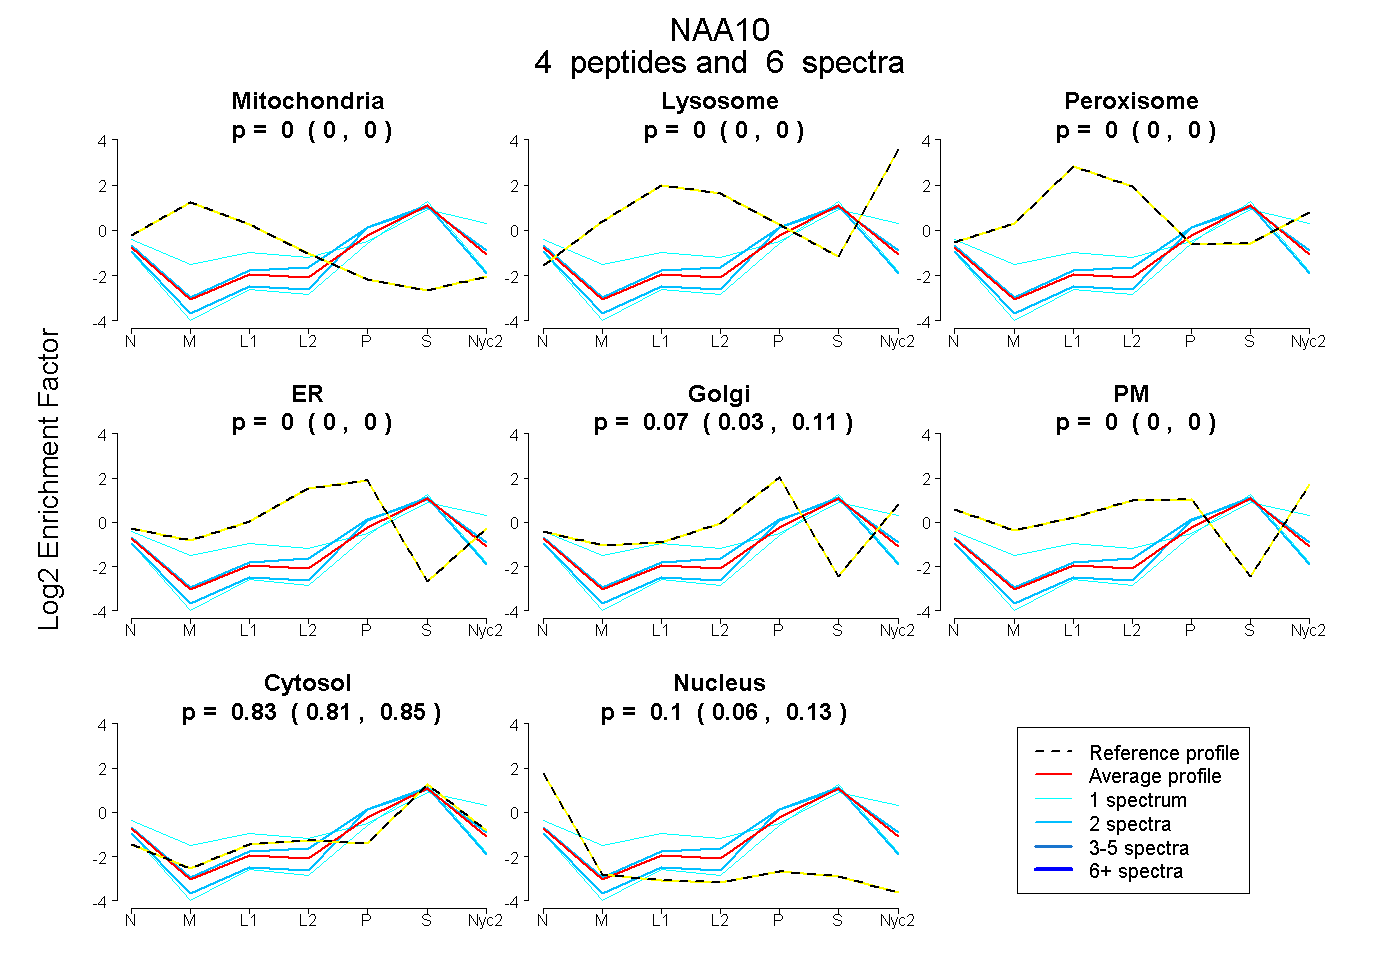
 4
4peptides
spectra
0.000 | 0.000
0.000 | 0.000
0.000 | 0.000
0.000 | 0.000
0.030 | 0.106
0.000 | 0.000
0.808 | 0.852
0.060 | 0.129
| Plot | Mito | Lyso | Perox | ER | Golgi | PM | Cytosol | Nucleus | |||||
| Expt A |
4 peptides |
6 spectra |
|
0.000 0.000 | 0.000 |
0.000 0.000 | 0.000 |
0.000 0.000 | 0.000 |
0.000 0.000 | 0.000 |
0.071 0.030 | 0.106 |
0.000 0.000 | 0.000 |
0.832 0.808 | 0.852 |
0.097 0.060 | 0.129 |
| 2 spectra, LMDQASR | 0.000 | 0.000 | 0.000 | 0.000 | 0.000 | 0.000 | 0.820 | 0.180 | ||
| 1 spectrum, DLSEVSETTESTDVK | 0.000 | 0.037 | 0.000 | 0.000 | 0.000 | 0.235 | 0.728 | 0.000 | ||
| 2 spectra, IVGYVLAK | 0.000 | 0.000 | 0.000 | 0.000 | 0.155 | 0.000 | 0.797 | 0.048 | ||
| 1 spectrum, GLTAEDSGGDSK | 0.000 | 0.000 | 0.000 | 0.000 | 0.000 | 0.000 | 0.806 | 0.194 |