 3
3peptides
spectra
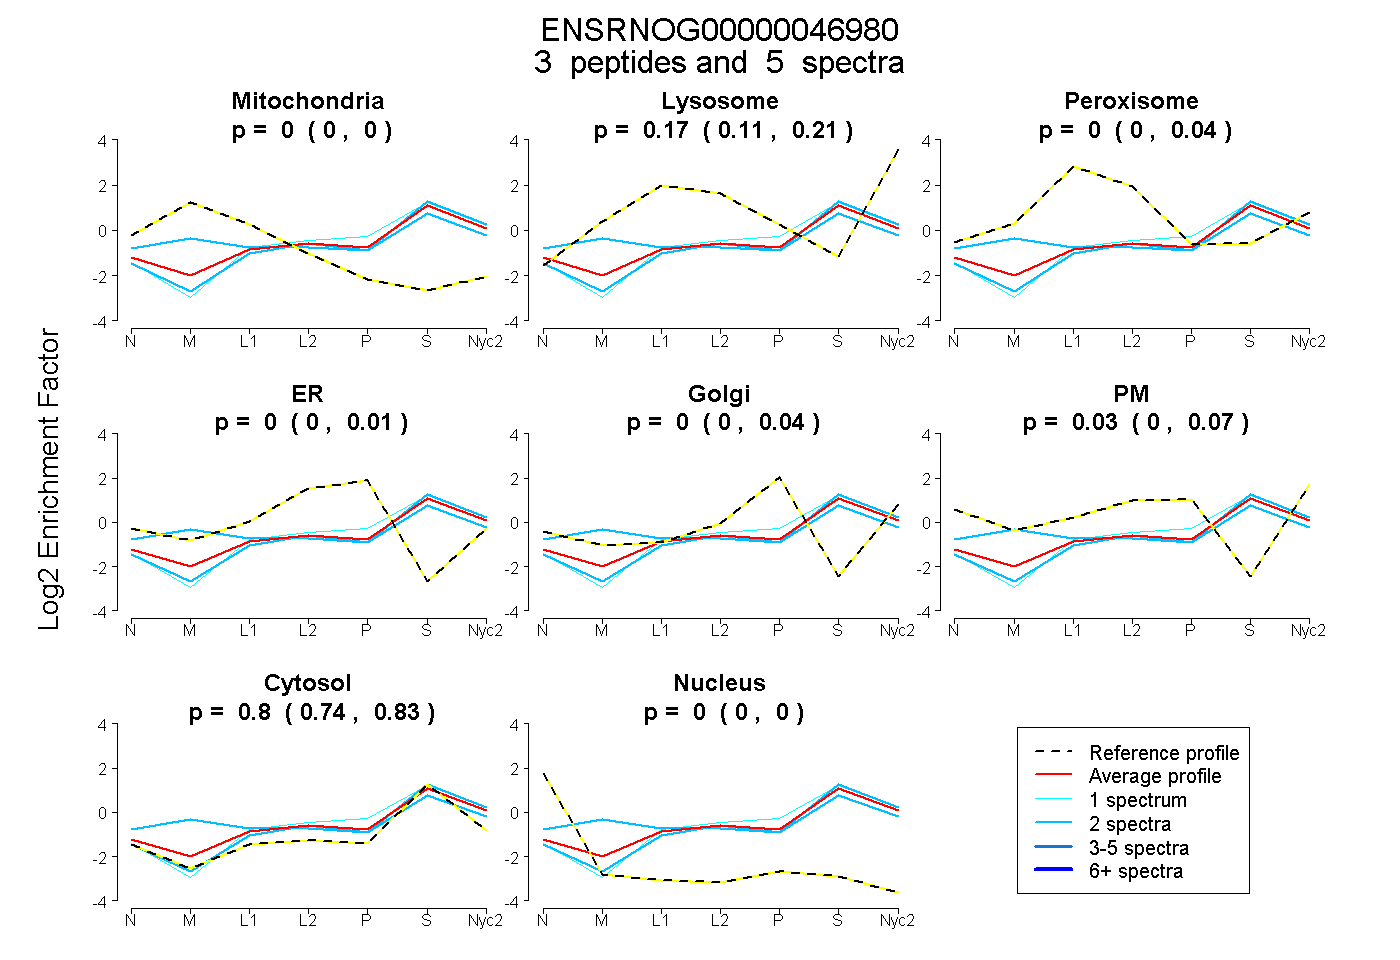
0.000 | 0.000
0.110 | 0.209
0.000 | 0.040
0.000 | 0.010
0.000 | 0.038
0.000 | 0.068
0.741 | 0.832
0.000 | 0.000
| Plot | Mito | Lyso | Perox | ER | Golgi | PM | Cytosol | Nucleus | |||||
| Expt A |
3 peptides |
5 spectra |
|
0.000 0.000 | 0.000 |
0.173 0.110 | 0.209 |
0.000 0.000 | 0.040 |
0.000 0.000 | 0.010 |
0.000 0.000 | 0.038 |
0.030 0.000 | 0.068 |
0.797 0.741 | 0.832 |
0.000 0.000 | 0.000 |
| 2 spectra, EAWISDIR | 0.000 | 0.149 | 0.000 | 0.000 | 0.000 | 0.000 | 0.851 | 0.000 | ||
| 1 spectrum, AGTTATCGNHIK | 0.000 | 0.146 | 0.000 | 0.000 | 0.059 | 0.000 | 0.796 | 0.000 | ||
| 2 spectra, VWDVAK | 0.193 | 0.170 | 0.026 | 0.000 | 0.000 | 0.009 | 0.603 | 0.000 |
| Plot | Lyso | Other | |||||||||||
| Expt C |
2 peptides |
3 spectra |
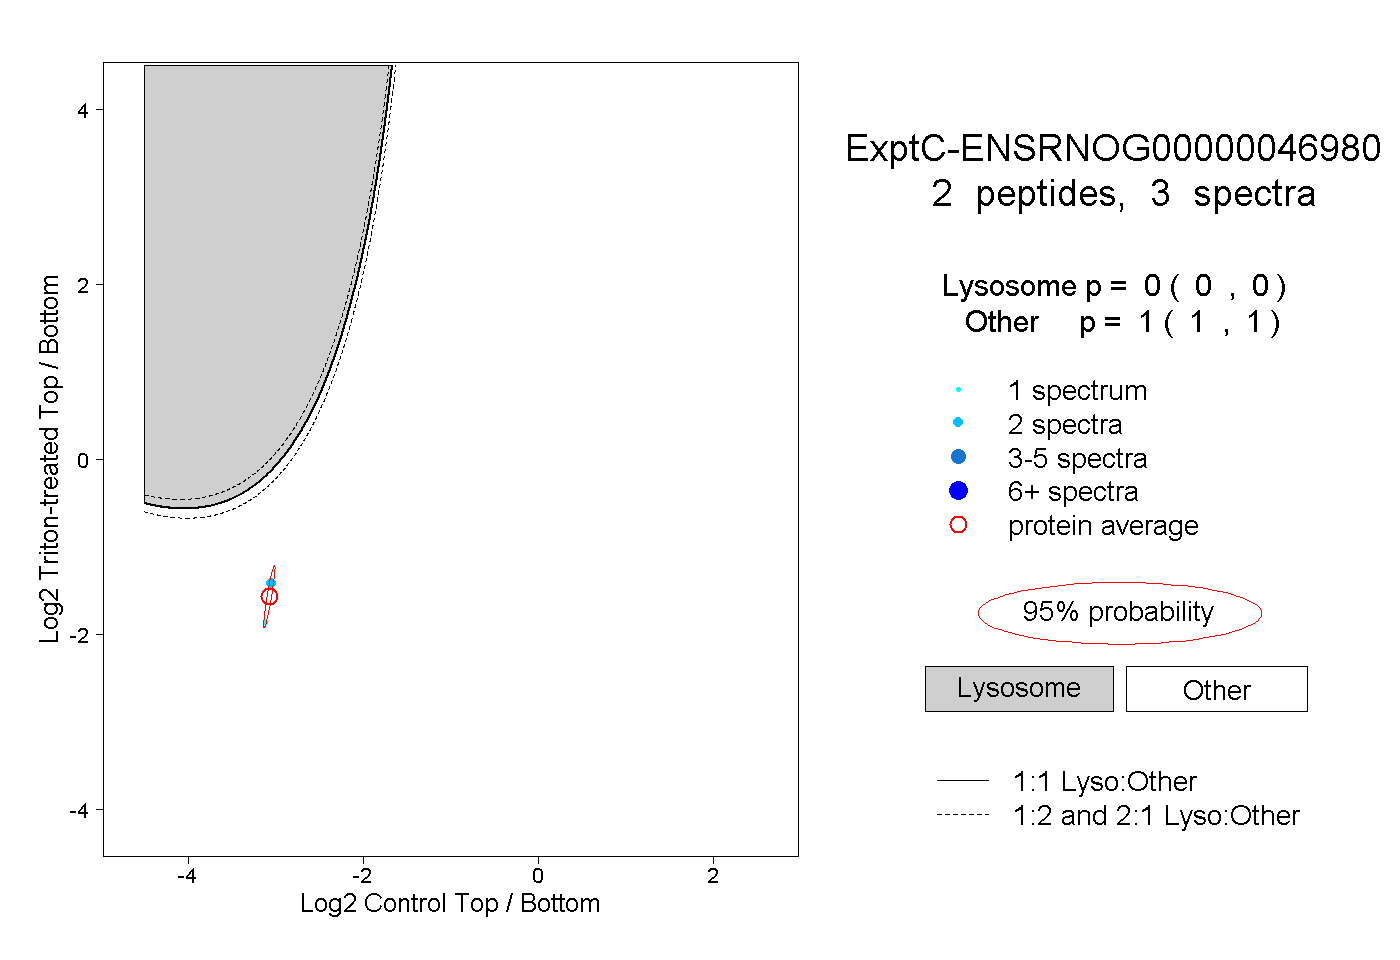 |
0.000 0.000 | 0.000 |
1.000 1.000 | 1.000 |