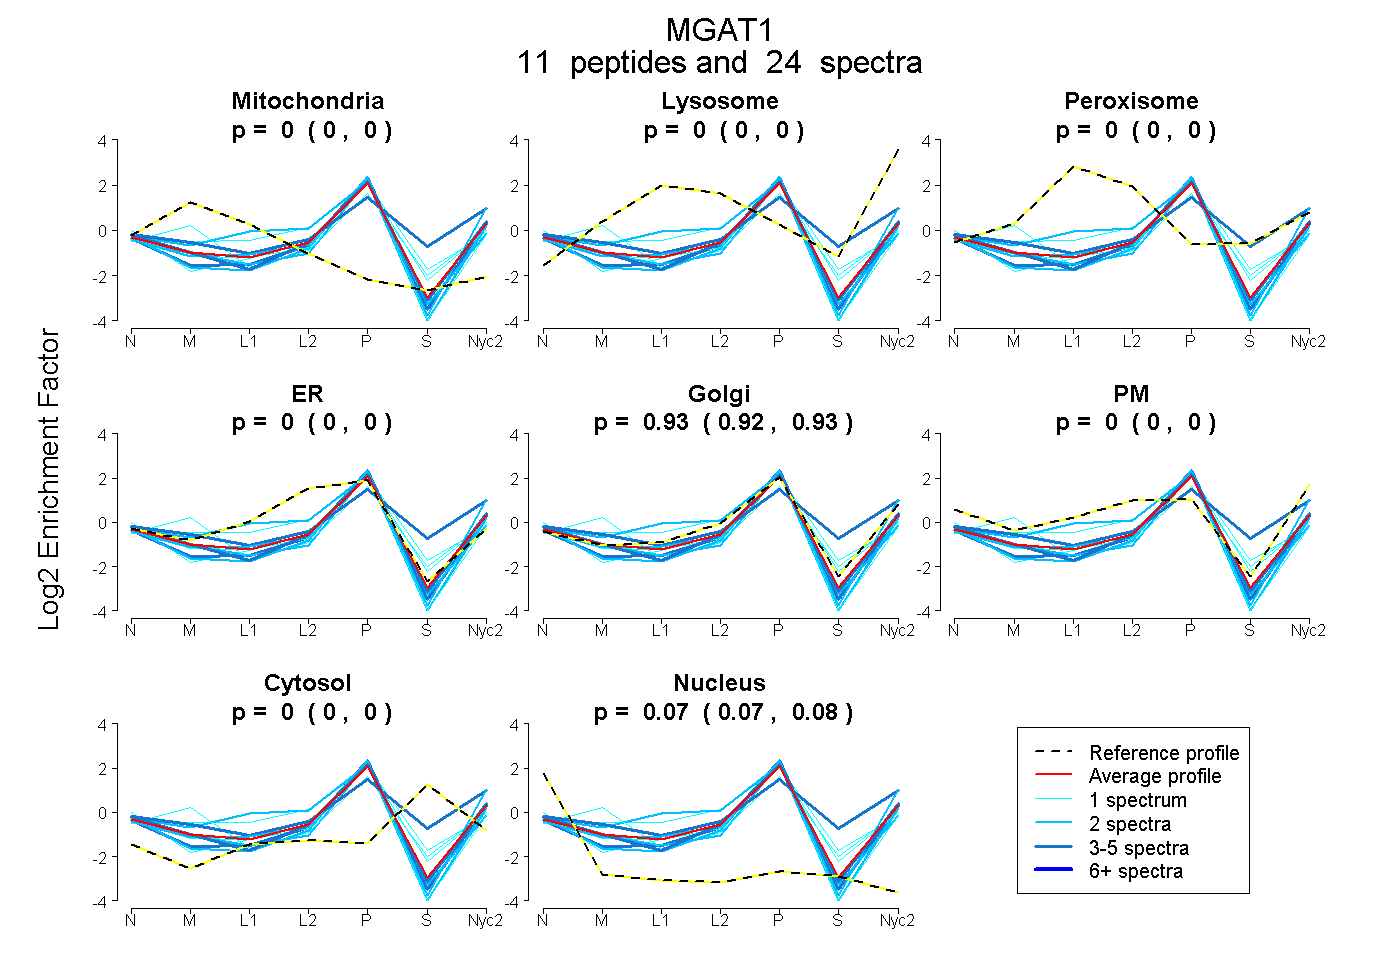
 11
11peptides
spectra
0.000 | 0.000
0.000 | 0.000
0.000 | 0.000
0.000 | 0.000
0.922 | 0.933
0.000 | 0.000
0.000 | 0.000
0.066 | 0.077
| Plot | Mito | Lyso | Perox | ER | Golgi | PM | Cytosol | Nucleus | |||||
| Expt A |
11 peptides |
24 spectra |
|
0.000 0.000 | 0.000 |
0.000 0.000 | 0.000 |
0.000 0.000 | 0.000 |
0.000 0.000 | 0.000 |
0.928 0.922 | 0.933 |
0.000 0.000 | 0.000 |
0.000 0.000 | 0.000 |
0.072 0.066 | 0.077 |
| 3 spectra, WALGQIFNK | 0.000 | 0.000 | 0.000 | 0.000 | 0.920 | 0.000 | 0.000 | 0.080 | ||
| 1 spectrum, GLLQQIK | 0.000 | 0.000 | 0.000 | 0.031 | 0.857 | 0.000 | 0.000 | 0.112 | ||
| 2 spectra, ELGEVR | 0.049 | 0.000 | 0.000 | 0.388 | 0.564 | 0.000 | 0.000 | 0.000 | ||
| 2 spectra, TMTFGR | 0.000 | 0.000 | 0.000 | 0.000 | 0.987 | 0.000 | 0.000 | 0.013 | ||
| 2 spectra, GIVTFQFR | 0.000 | 0.000 | 0.000 | 0.000 | 0.880 | 0.000 | 0.000 | 0.120 | ||
| 1 spectrum, ACIRPEISR | 0.000 | 0.000 | 0.000 | 0.000 | 0.815 | 0.000 | 0.094 | 0.091 | ||
| 2 spectra, ALGVMDDLK | 0.000 | 0.000 | 0.000 | 0.000 | 0.874 | 0.000 | 0.000 | 0.126 | ||
| 1 spectrum, EHYSLWR | 0.084 | 0.000 | 0.000 | 0.284 | 0.626 | 0.000 | 0.006 | 0.000 | ||
| 1 spectrum, EQMVDSSKPELLYR | 0.171 | 0.000 | 0.000 | 0.000 | 0.783 | 0.000 | 0.019 | 0.026 | ||
| 4 spectra, QPDLSNIAVQPDHR | 0.000 | 0.063 | 0.000 | 0.000 | 0.594 | 0.113 | 0.230 | 0.000 | ||
| 5 spectra, AFWDDWMR | 0.000 | 0.000 | 0.000 | 0.000 | 0.912 | 0.000 | 0.000 | 0.088 |
| Plot | Mito | Lyso or Perox | ER | Golgi | PM | Cytosol | Nucleus | ||||||
| Expt B |
1 peptide |
1 spectrum |
 |
0.000 NA | NA |
0.191 NA | NA |
0.000 NA | NA |
0.787 NA | NA |
0.000 NA | NA |
0.021 NA | NA |
0.000 NA | NA |
|||
| Plot | Lyso | Other | |||||||||||
| Expt C |
7 peptides |
14 spectra |
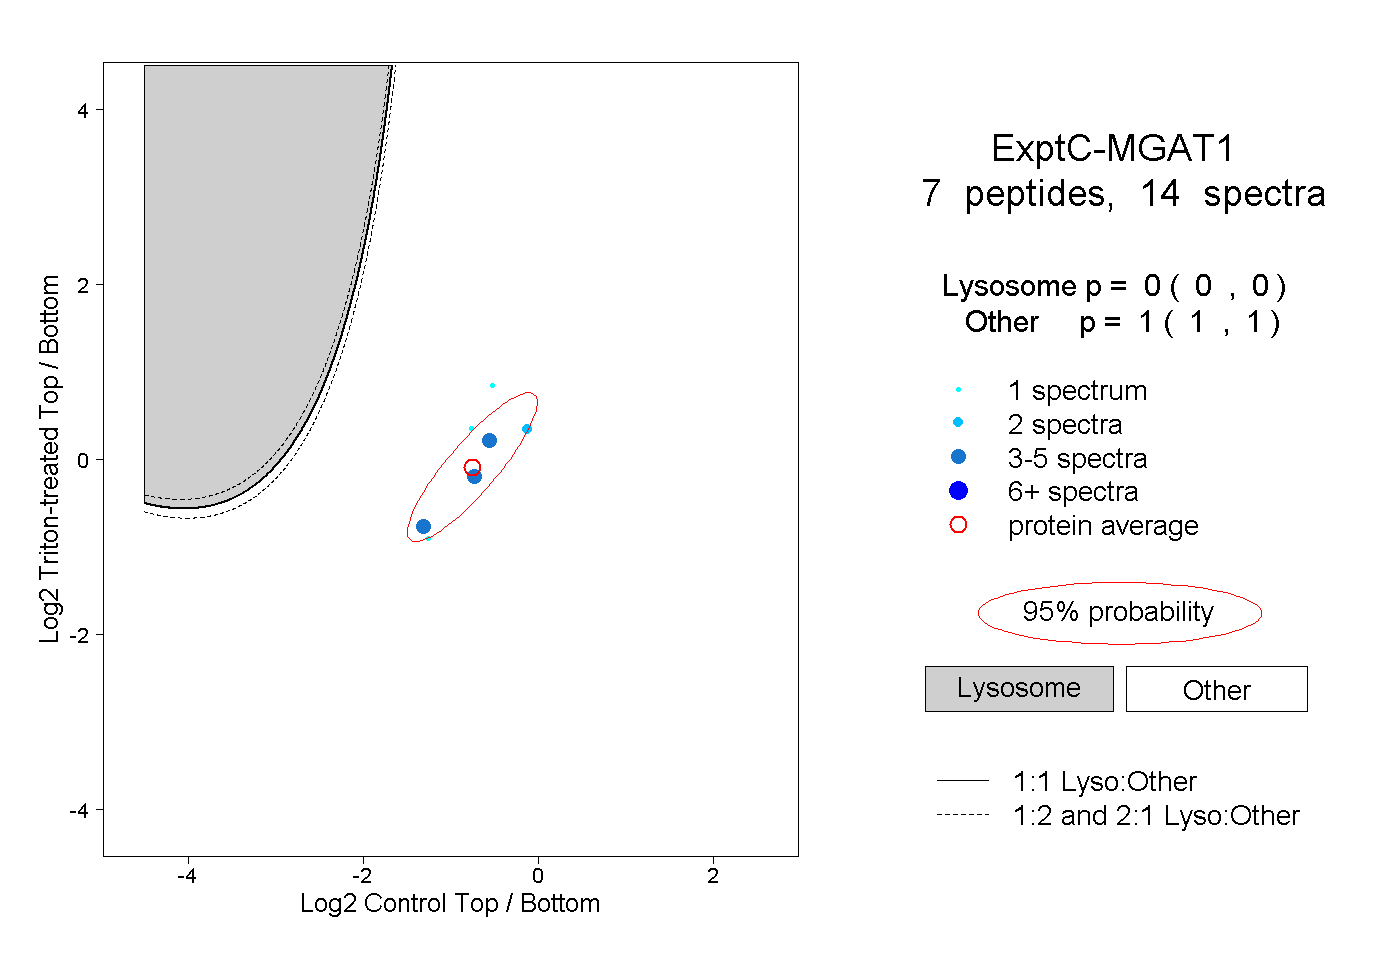 |
0.000 0.000 | 0.000 |
1.000 1.000 | 1.000 |