 20
20peptides
spectra
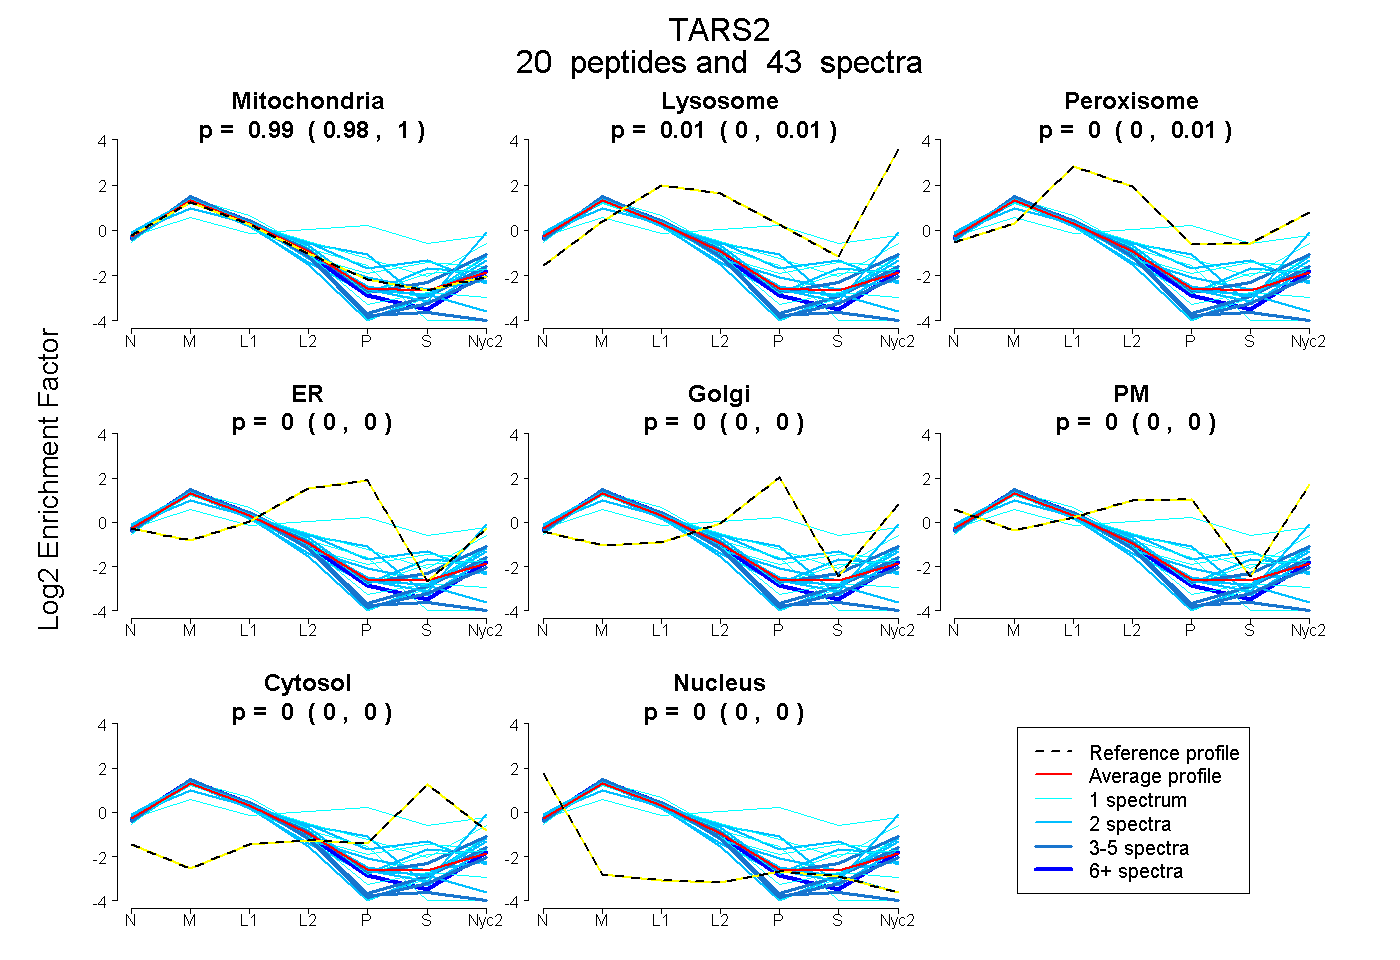
0.984 | 0.999
0.000 | 0.014
0.000 | 0.009
0.000 | 0.000
0.000 | 0.000
0.000 | 0.000
0.000 | 0.000
0.000 | 0.000
8peptides
spectra
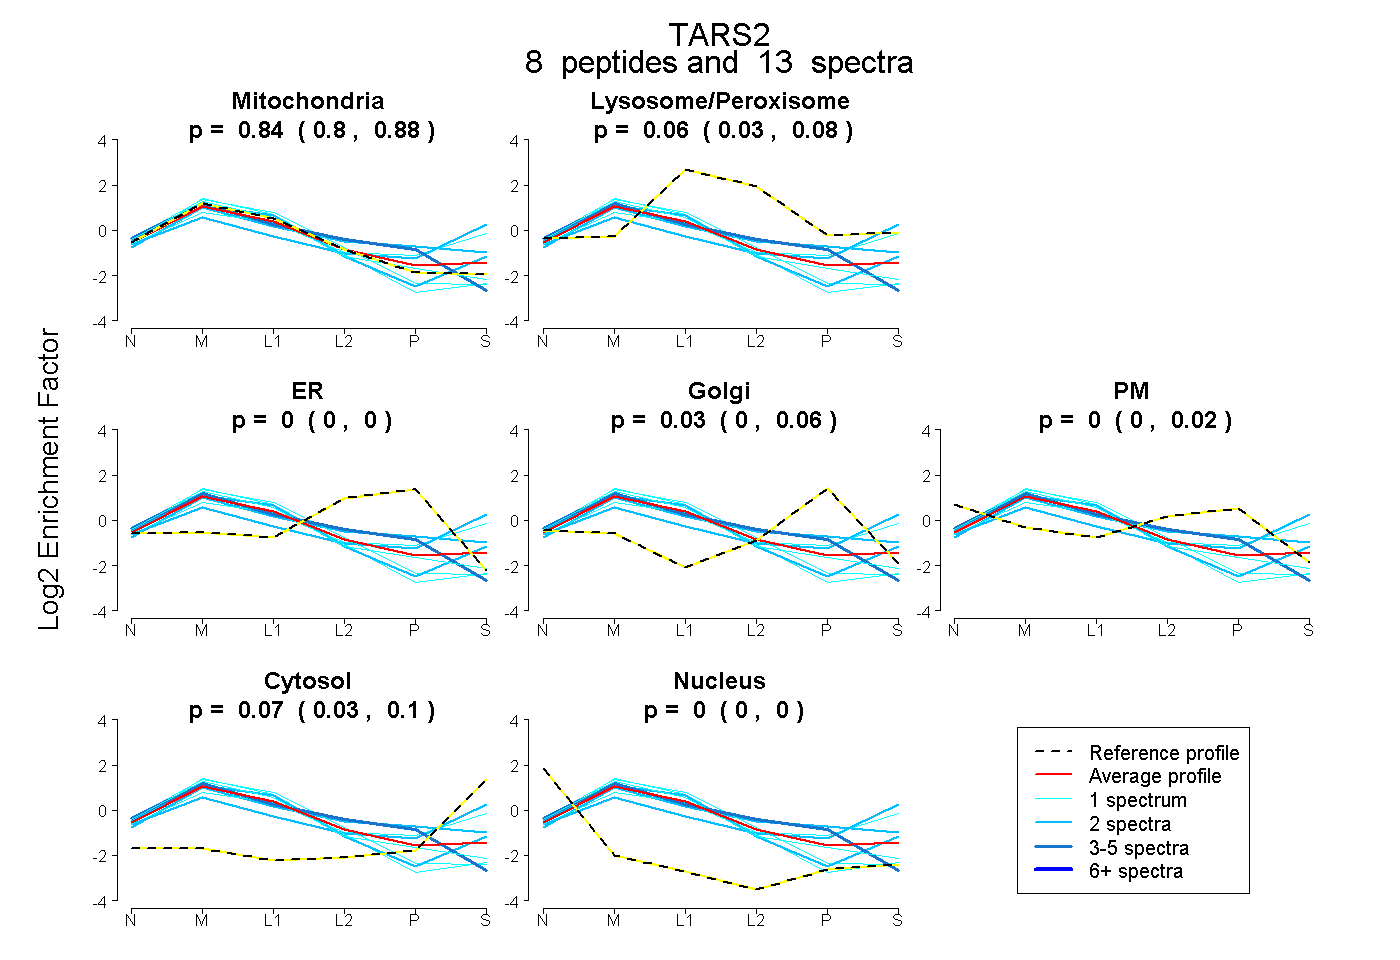
0.797 | 0.883
0.026 | 0.078
0.000 | 0.000
0.000 | 0.064
0.000 | 0.016
0.032 | 0.099
0.000 | 0.000
26peptides
spectra
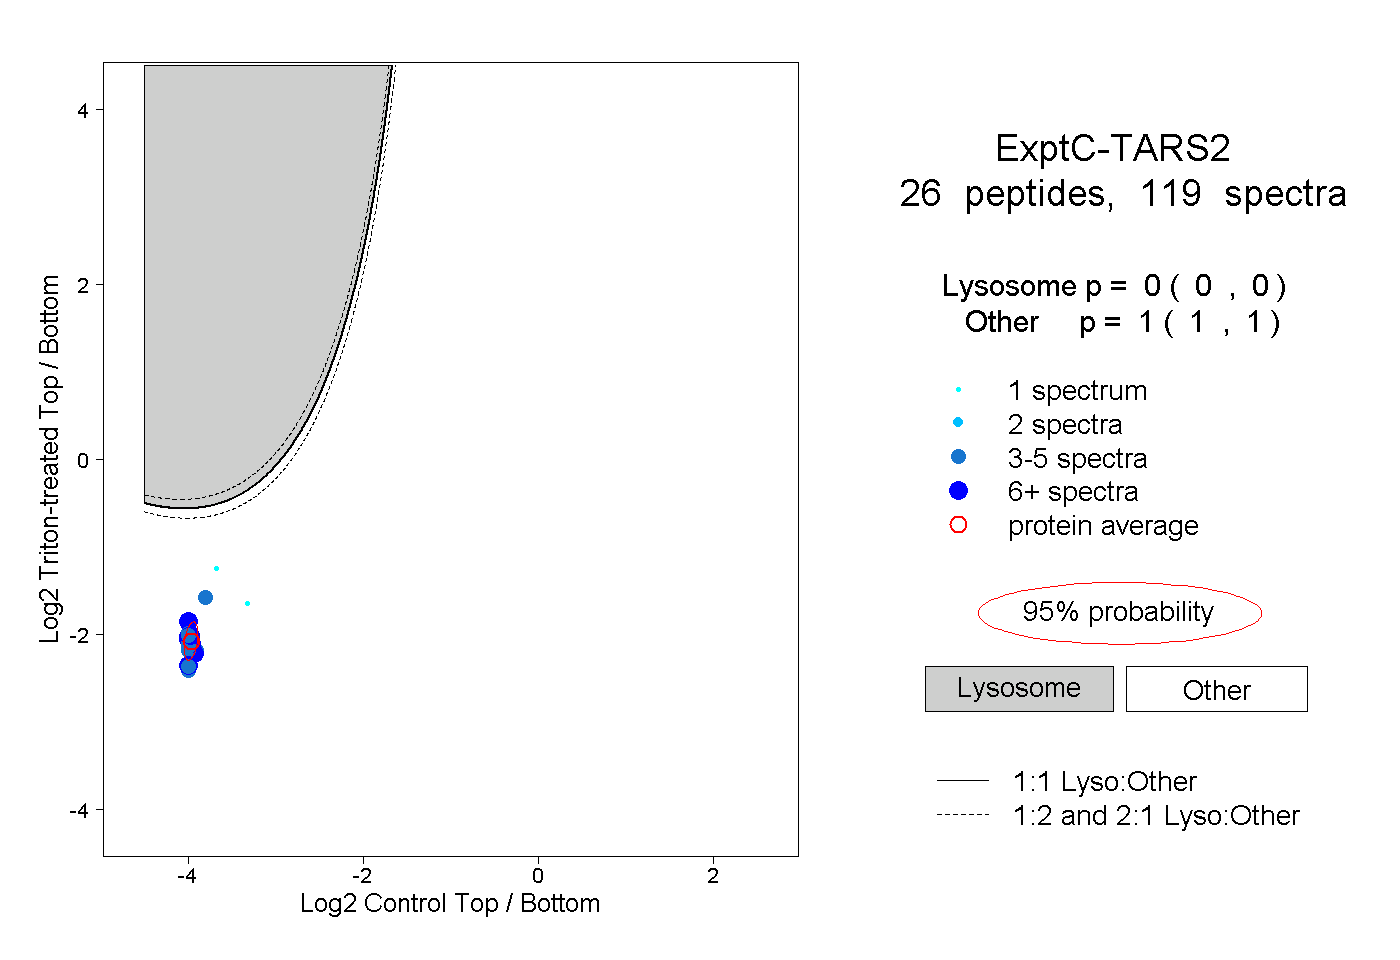
0.000 | 0.000
1.000 | 1.000
10peptides
spectra
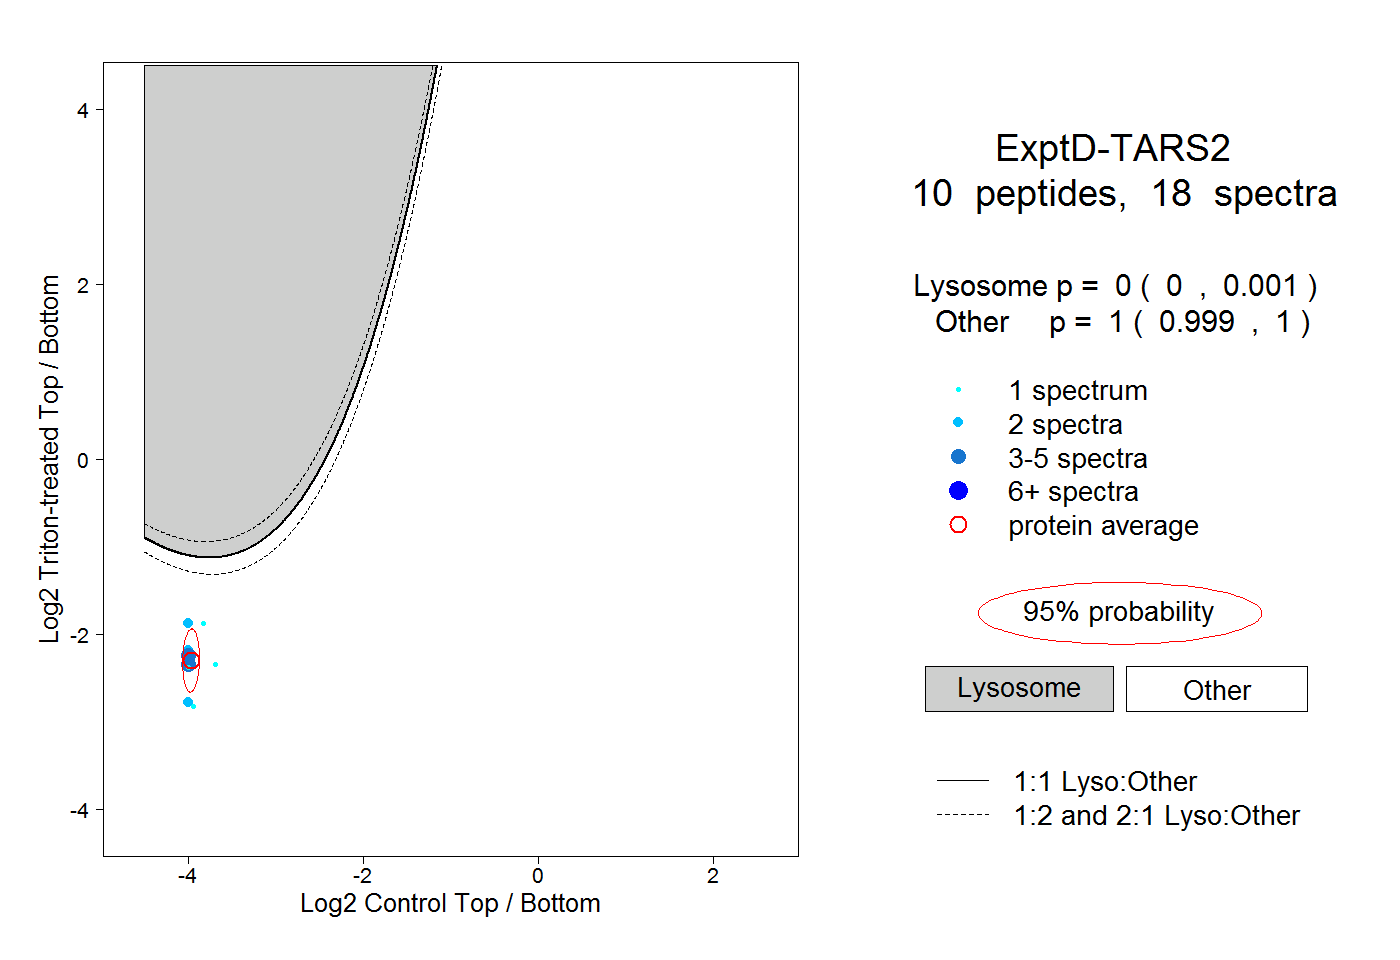
0.000 | 0.001
0.999 | 1.000