 20
20peptides
spectra
0.984 | 0.999
0.000 | 0.014
0.000 | 0.009
0.000 | 0.000
0.000 | 0.000
0.000 | 0.000
0.000 | 0.000
0.000 | 0.000
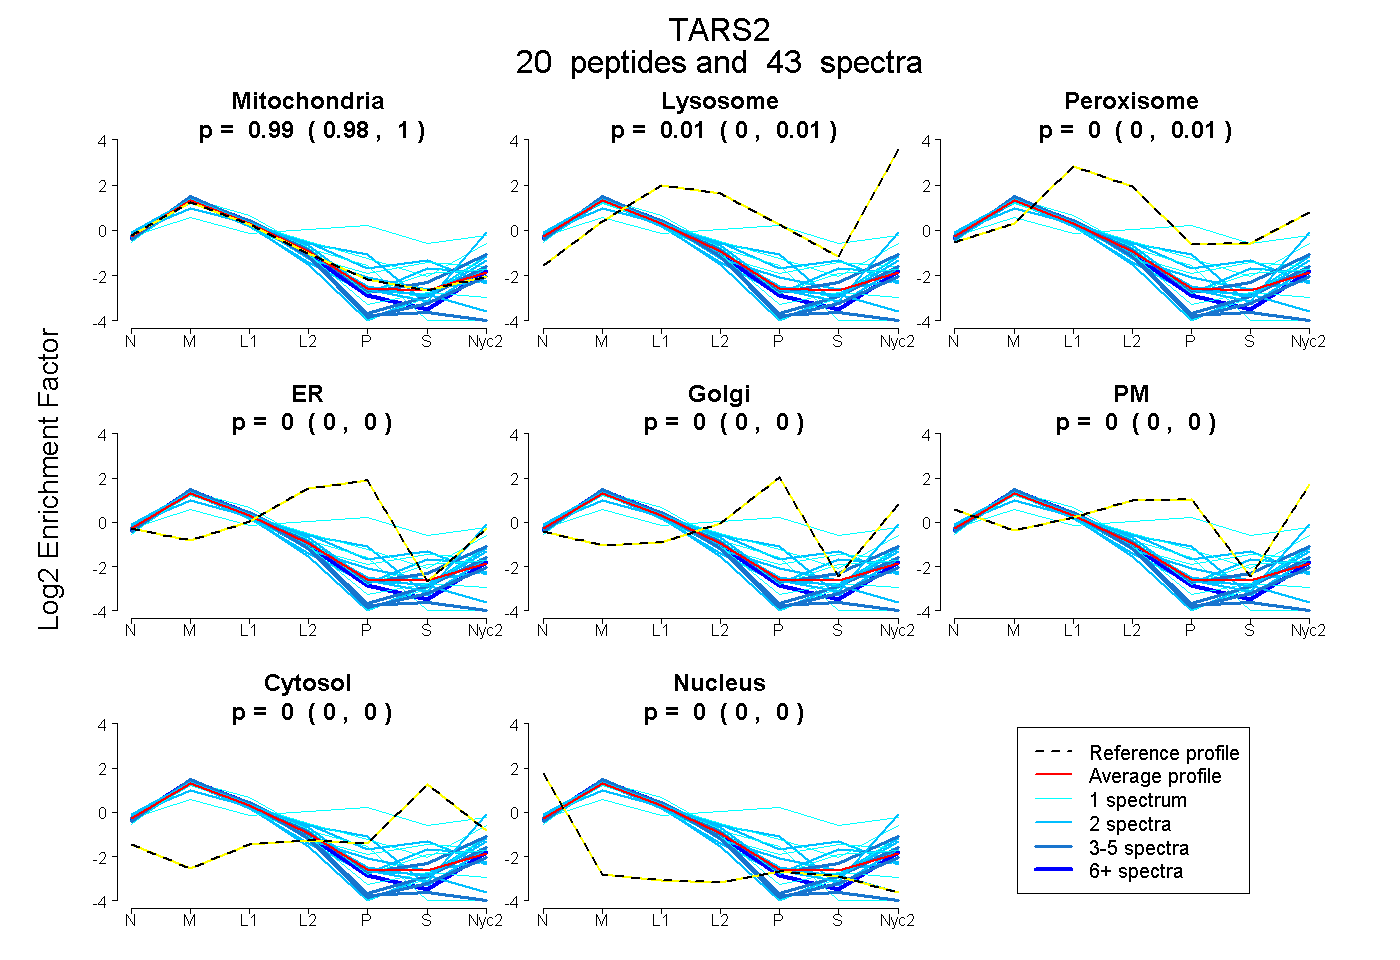
| Plot | Mito | Lyso | Perox | ER | Golgi | PM | Cytosol | Nucleus | |||||
| Expt A |
20 peptides |
43 spectra |
|
0.992 0.984 | 0.999 |
0.005 0.000 | 0.014 |
0.002 0.000 | 0.009 |
0.000 0.000 | 0.000 |
0.000 0.000 | 0.000 |
0.000 0.000 | 0.000 |
0.000 0.000 | 0.000 |
0.000 0.000 | 0.000 |
| 2 spectra, AQLAHYNFQFVVGQR | 0.796 | 0.000 | 0.000 | 0.200 | 0.000 | 0.004 | 0.000 | 0.000 | ||
| 2 spectra, AVLGSVER | 0.892 | 0.000 | 0.000 | 0.000 | 0.000 | 0.000 | 0.108 | 0.000 | ||
| 1 spectrum, FGLFEELWTAQVK | 0.976 | 0.000 | 0.000 | 0.000 | 0.000 | 0.000 | 0.000 | 0.024 | ||
| 2 spectra, VSGISFPK | 0.808 | 0.191 | 0.000 | 0.000 | 0.000 | 0.000 | 0.000 | 0.001 | ||
| 4 spectra, LLELQDAR | 1.000 | 0.000 | 0.000 | 0.000 | 0.000 | 0.000 | 0.000 | 0.000 | ||
| 2 spectra, GPAGAPECPVLIHR | 1.000 | 0.000 | 0.000 | 0.000 | 0.000 | 0.000 | 0.000 | 0.000 | ||
| 1 spectrum, EQELFFFHELSPGSCFFLPR | 0.792 | 0.000 | 0.074 | 0.000 | 0.000 | 0.000 | 0.134 | 0.000 | ||
| 1 spectrum, GLAEDVTR | 0.233 | 0.000 | 0.270 | 0.000 | 0.333 | 0.000 | 0.165 | 0.000 | ||
| 1 spectrum, LASMTQK | 0.695 | 0.143 | 0.000 | 0.000 | 0.000 | 0.142 | 0.019 | 0.000 | ||
| 2 spectra, LLTNSSALWR | 0.945 | 0.055 | 0.000 | 0.000 | 0.000 | 0.000 | 0.000 | 0.000 | ||
| 3 spectra, ICQEIITAAQPFR | 0.934 | 0.000 | 0.000 | 0.000 | 0.000 | 0.000 | 0.000 | 0.066 | ||
| 1 spectrum, LLGVLAESCGGR | 0.972 | 0.000 | 0.000 | 0.000 | 0.000 | 0.000 | 0.000 | 0.028 | ||
| 1 spectrum, STELPTLER | 0.893 | 0.000 | 0.059 | 0.000 | 0.000 | 0.000 | 0.048 | 0.000 | ||
| 2 spectra, AEASGSLGGLTR | 0.939 | 0.061 | 0.000 | 0.000 | 0.000 | 0.000 | 0.000 | 0.000 | ||
| 4 spectra, TEQEDYAR | 1.000 | 0.000 | 0.000 | 0.000 | 0.000 | 0.000 | 0.000 | 0.000 | ||
| 1 spectrum, LHVIEEK | 0.984 | 0.016 | 0.000 | 0.000 | 0.000 | 0.000 | 0.000 | 0.000 | ||
| 3 spectra, SSEAPETLQR | 0.900 | 0.100 | 0.000 | 0.000 | 0.000 | 0.000 | 0.000 | 0.000 | ||
| 6 spectra, EQSQMSVNVR | 1.000 | 0.000 | 0.000 | 0.000 | 0.000 | 0.000 | 0.000 | 0.000 | ||
| 2 spectra, EAPIPTPPHWLAER | 0.775 | 0.000 | 0.089 | 0.000 | 0.000 | 0.000 | 0.136 | 0.000 | ||
| 2 spectra, GFSEVK | 0.888 | 0.000 | 0.000 | 0.000 | 0.000 | 0.000 | 0.000 | 0.112 |
| Plot | Mito | Lyso or Perox | ER | Golgi | PM | Cytosol | Nucleus | ||||||
| Expt B |
8 peptides |
13 spectra |
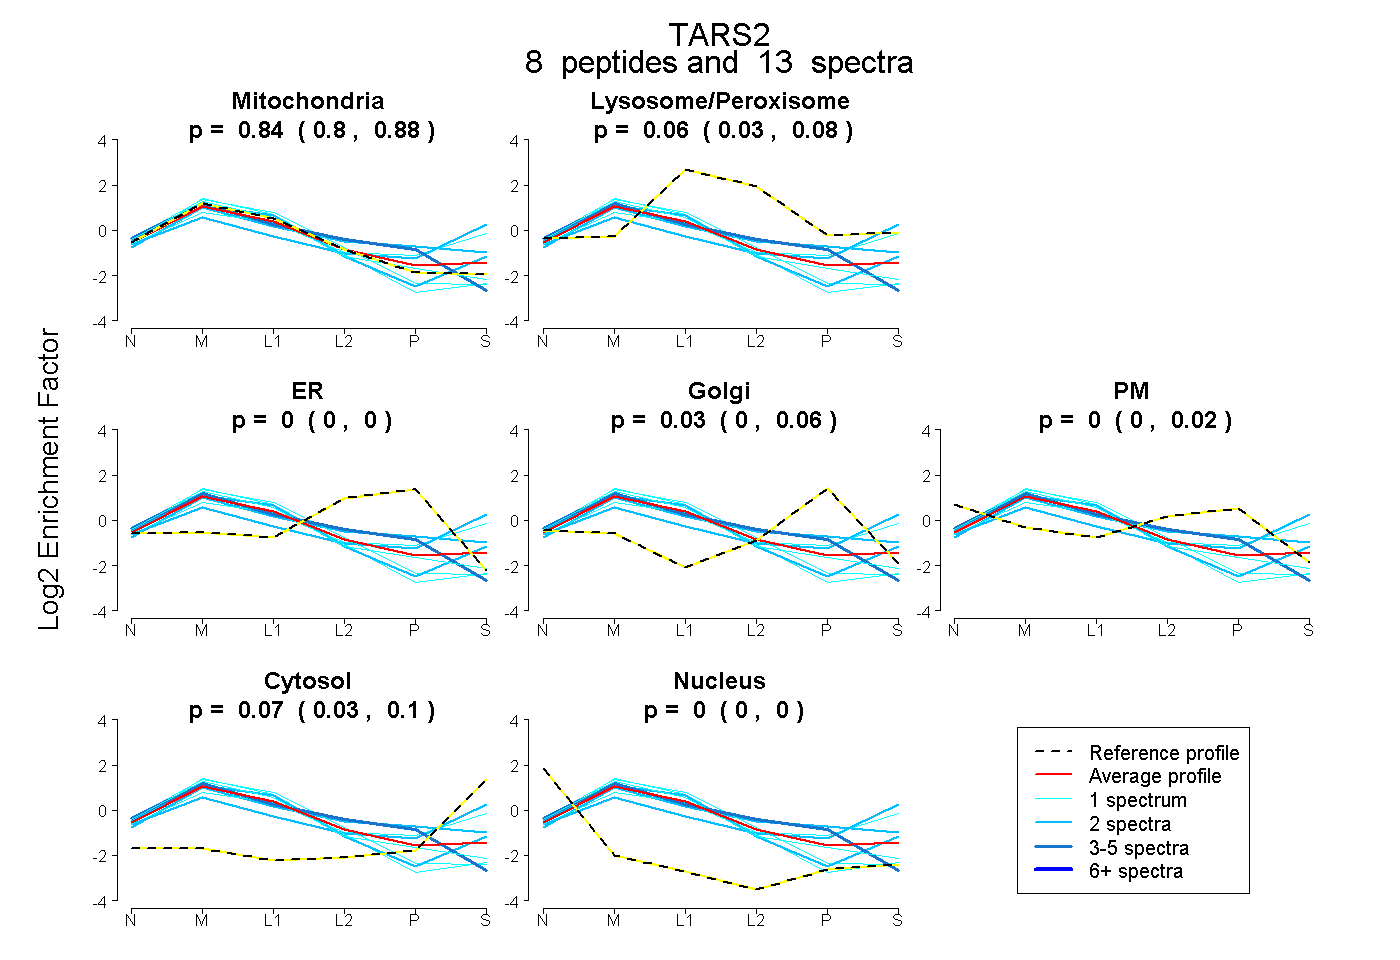 |
0.843 0.797 | 0.883 |
0.056 0.026 | 0.078 |
0.000 0.000 | 0.000 |
0.031 0.000 | 0.064 |
0.000 0.000 | 0.016 |
0.070 0.032 | 0.099 |
0.000 0.000 | 0.000 |
|||
| Plot | Lyso | Other | |||||||||||
| Expt C |
26 peptides |
119 spectra |
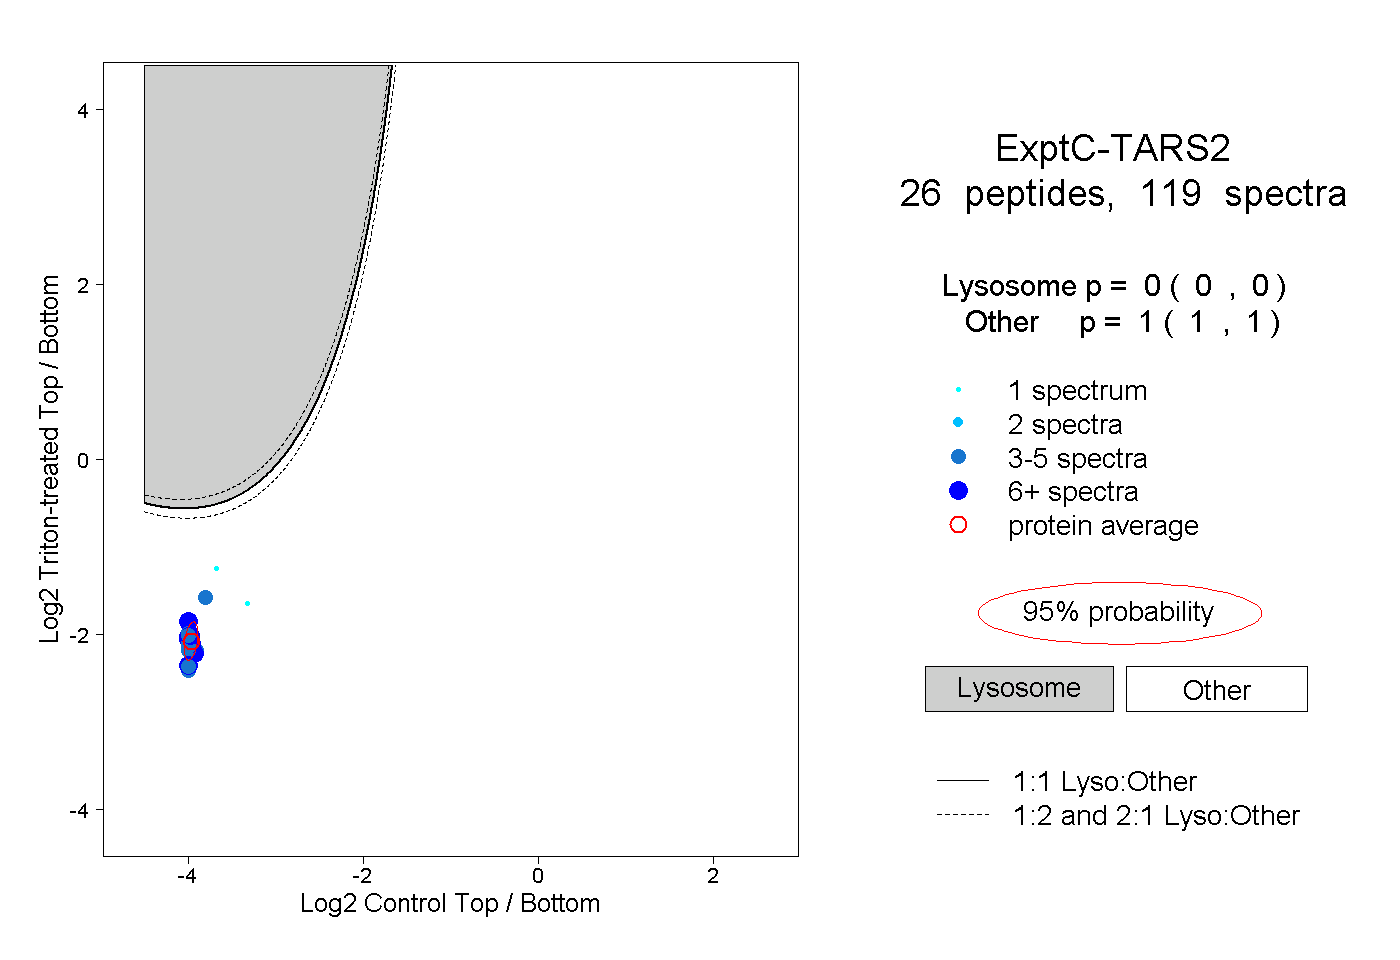 |
0.000 0.000 | 0.000 |
1.000 1.000 | 1.000 |
||||||||
| Plot | Lyso | Other | |||||||||||
| Expt D |
10 peptides |
18 spectra |
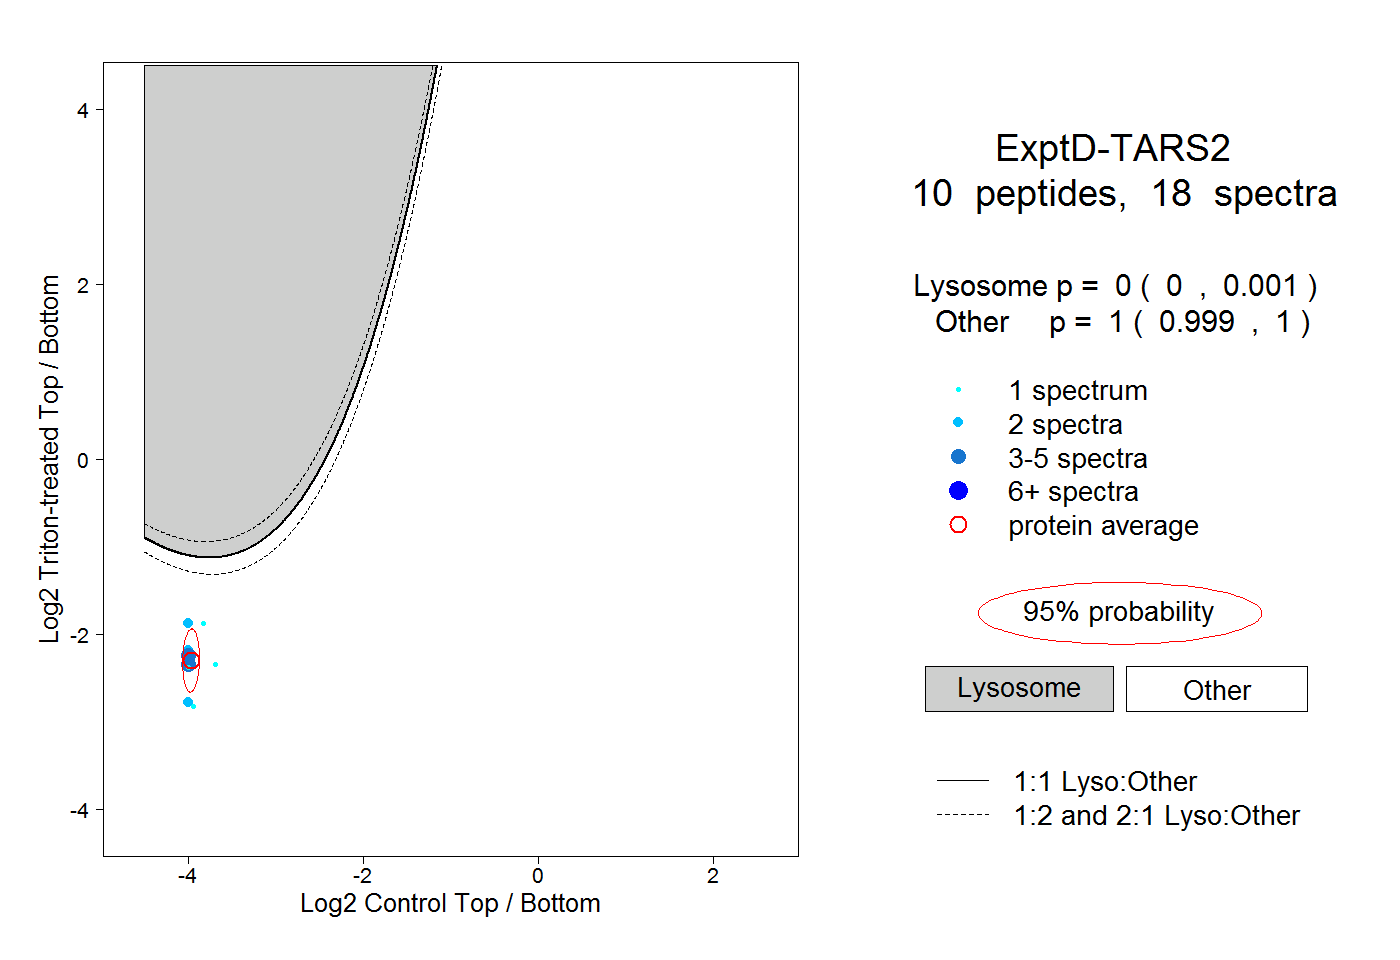 |
0.000 0.000 | 0.001 |
1.000 0.999 | 1.000 |