 2
2peptides
spectra
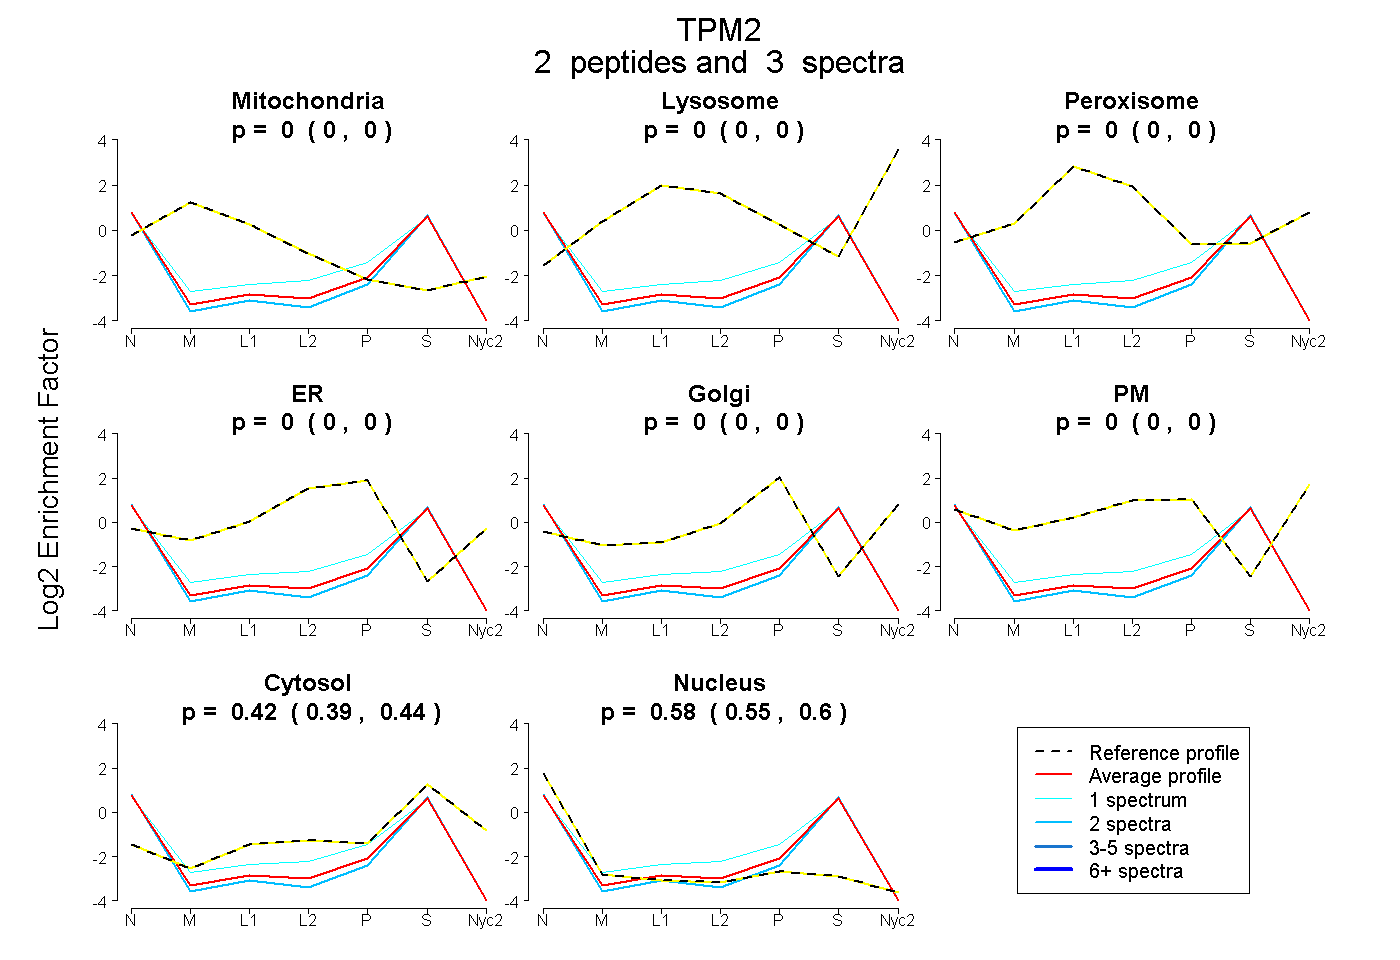
0.000 | 0.000
0.000 | 0.000
0.000 | 0.000
0.000 | 0.000
0.000 | 0.000
0.000 | 0.000
0.391 | 0.442
0.554 | 0.603
| Plot | Mito | Lyso | Perox | ER | Golgi | PM | Cytosol | Nucleus | |||||
| Expt A |
2 peptides |
3 spectra |
|
0.000 0.000 | 0.000 |
0.000 0.000 | 0.000 |
0.000 0.000 | 0.000 |
0.000 0.000 | 0.000 |
0.000 0.000 | 0.000 |
0.000 0.000 | 0.000 |
0.419 0.391 | 0.442 |
0.581 0.554 | 0.603 |
| 2 spectra, TIDDLEETLASAK | 0.000 | 0.000 | 0.000 | 0.000 | 0.000 | 0.000 | 0.382 | 0.618 | ||
| 1 spectrum, GTEDEVEK | 0.000 | 0.000 | 0.000 | 0.000 | 0.000 | 0.000 | 0.492 | 0.508 |
| Plot | Lyso | Other | |||||||||||
| Expt C |
1 peptide |
2 spectra |
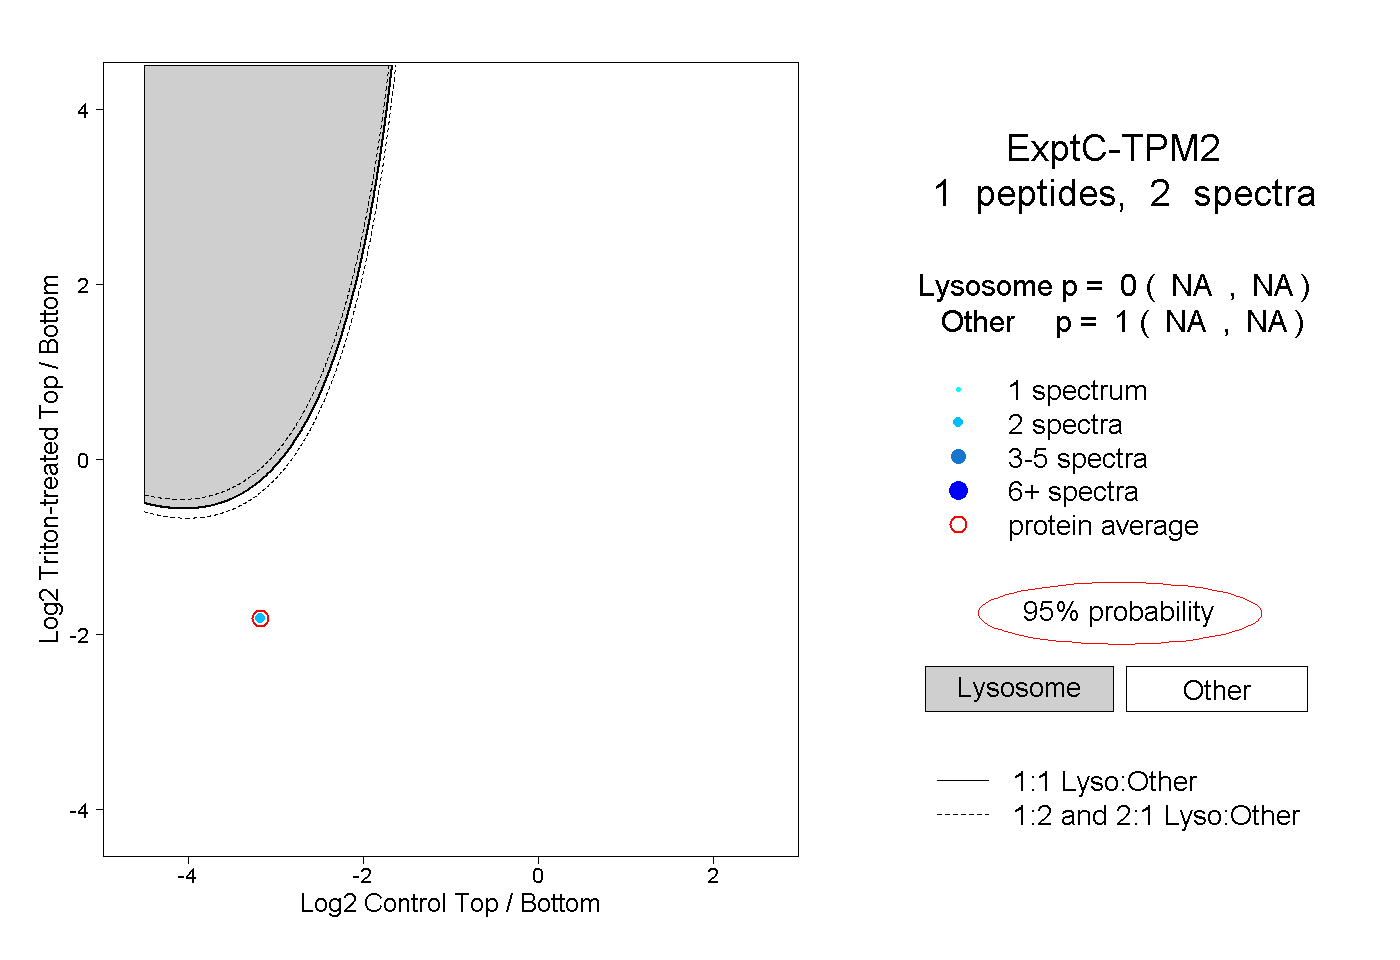 |
0.000 NA | NA |
1.000 NA | NA |