TARS
[ENSRNOP00000044467]
Main page
| | | Plot |
Mito |
Lyso |
|
Perox |
ER |
Golgi |
PM |
Cytosol |
Nucleus |
|
| Expt A |
 30
30
peptides |
153
spectra |
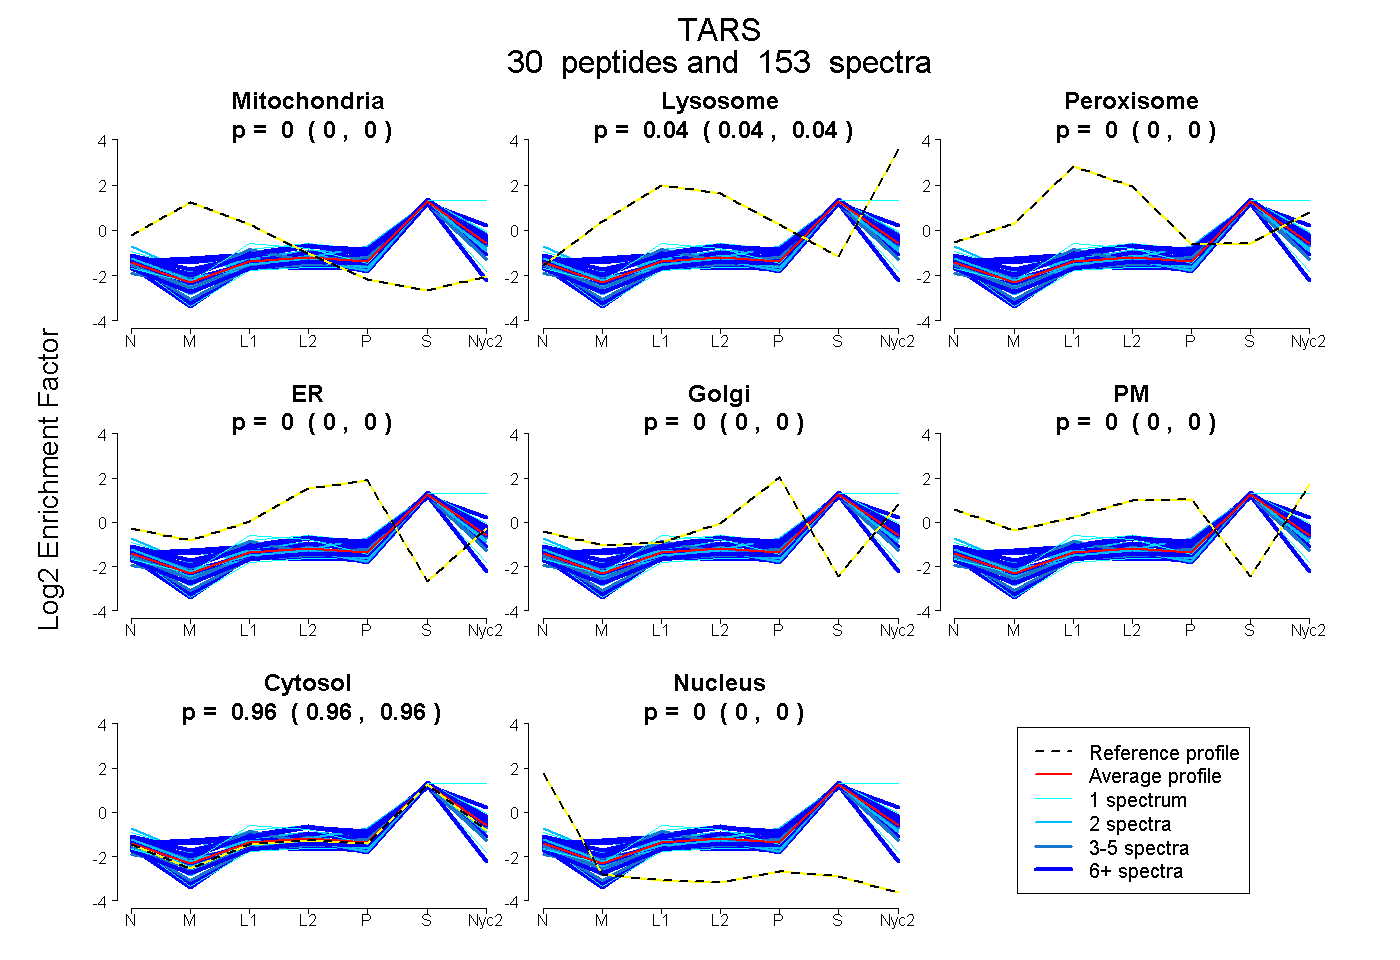 |
0.000
0.000 | 0.000 |
0.041
0.039 | 0.042 |
|
0.000
0.000 | 0.000 |
0.000
0.000 | 0.000 |
0.000
0.000 | 0.000 |
0.000
0.000 | 0.000 |
0.959
0.958 | 0.961 |
0.000
0.000 | 0.000 |
|
| | | Plot |
Mito |
|
Lyso or Perox |
|
ER |
Golgi |
PM |
Cytosol |
Nucleus |
|
| Expt B |
18
peptides |
67
spectra |
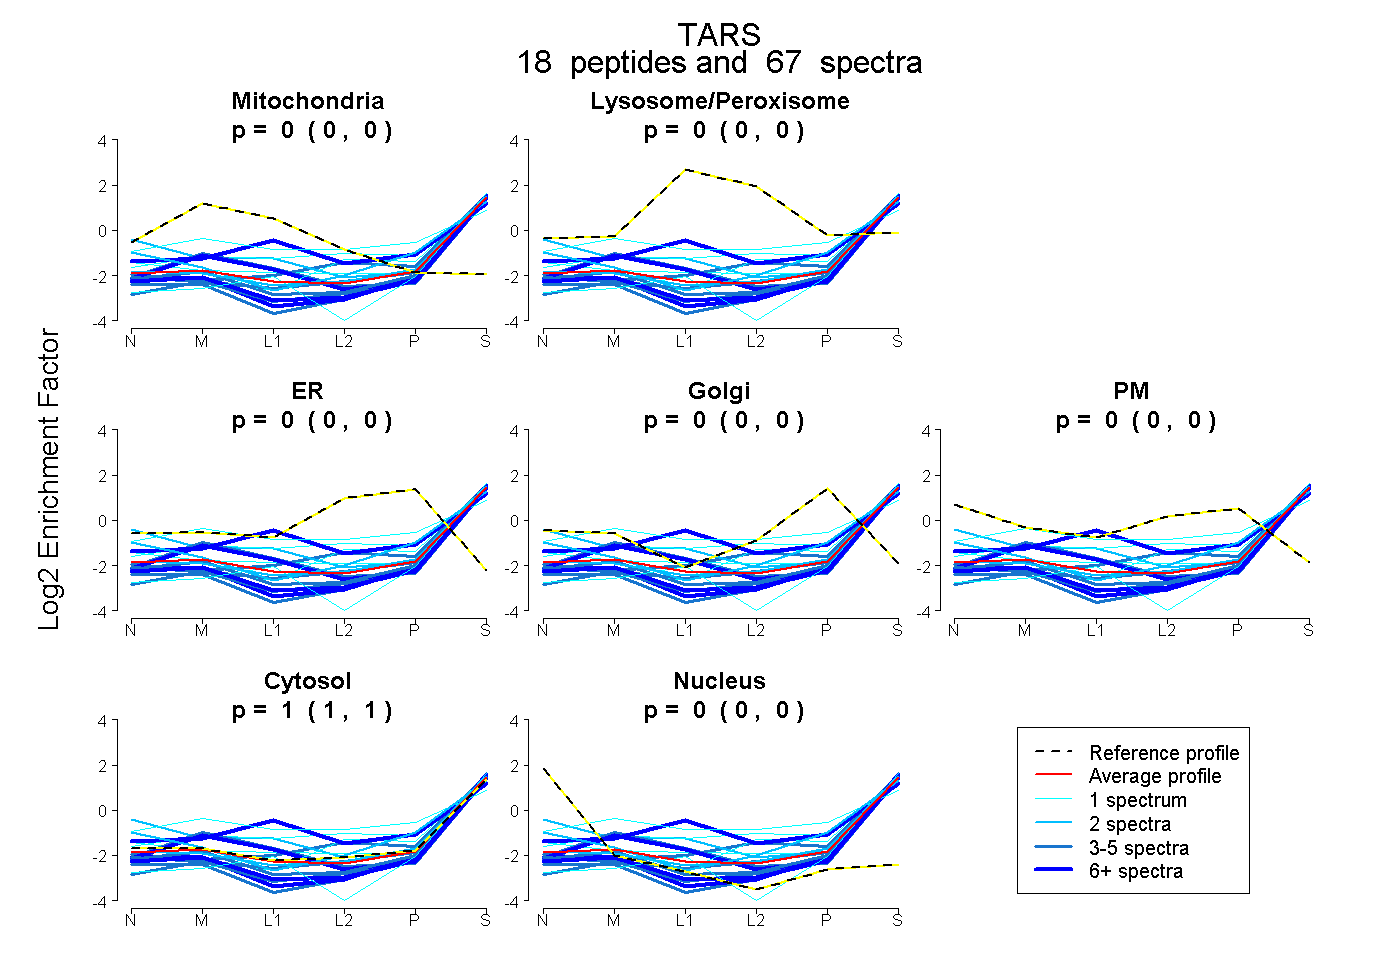 |
0.000
0.000 | 0.000 |
|
0.000
0.000 | 0.000 |
|
0.000
0.000 | 0.000 |
0.000
0.000 | 0.000 |
0.000
0.000 | 0.000 |
1.000
1.000 | 1.000 |
0.000
0.000 | 0.000 |
|
| | | Plot |
|
Lyso |
|
|
|
|
|
|
|
Other |
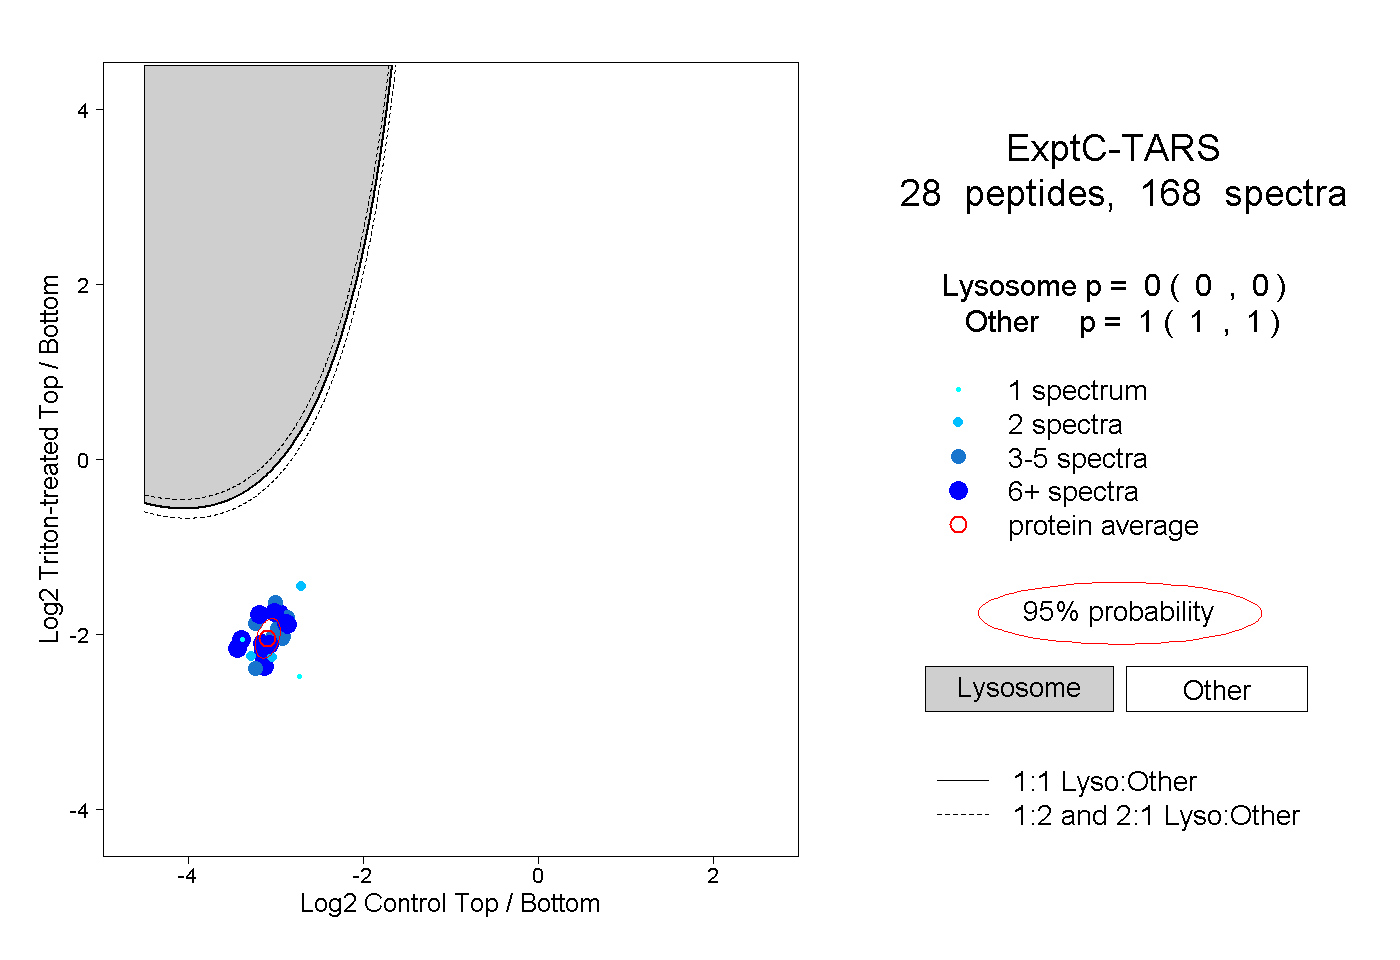
| Expt C |
28
peptides |
168
spectra |
 |
|
0.000
0.000 | 0.000 |
|
|
|
|
|
|
|
1.000
1.000 | 1.000 |
| | | Plot |
|
Lyso |
|
|
|
|
|
|
|
Other |
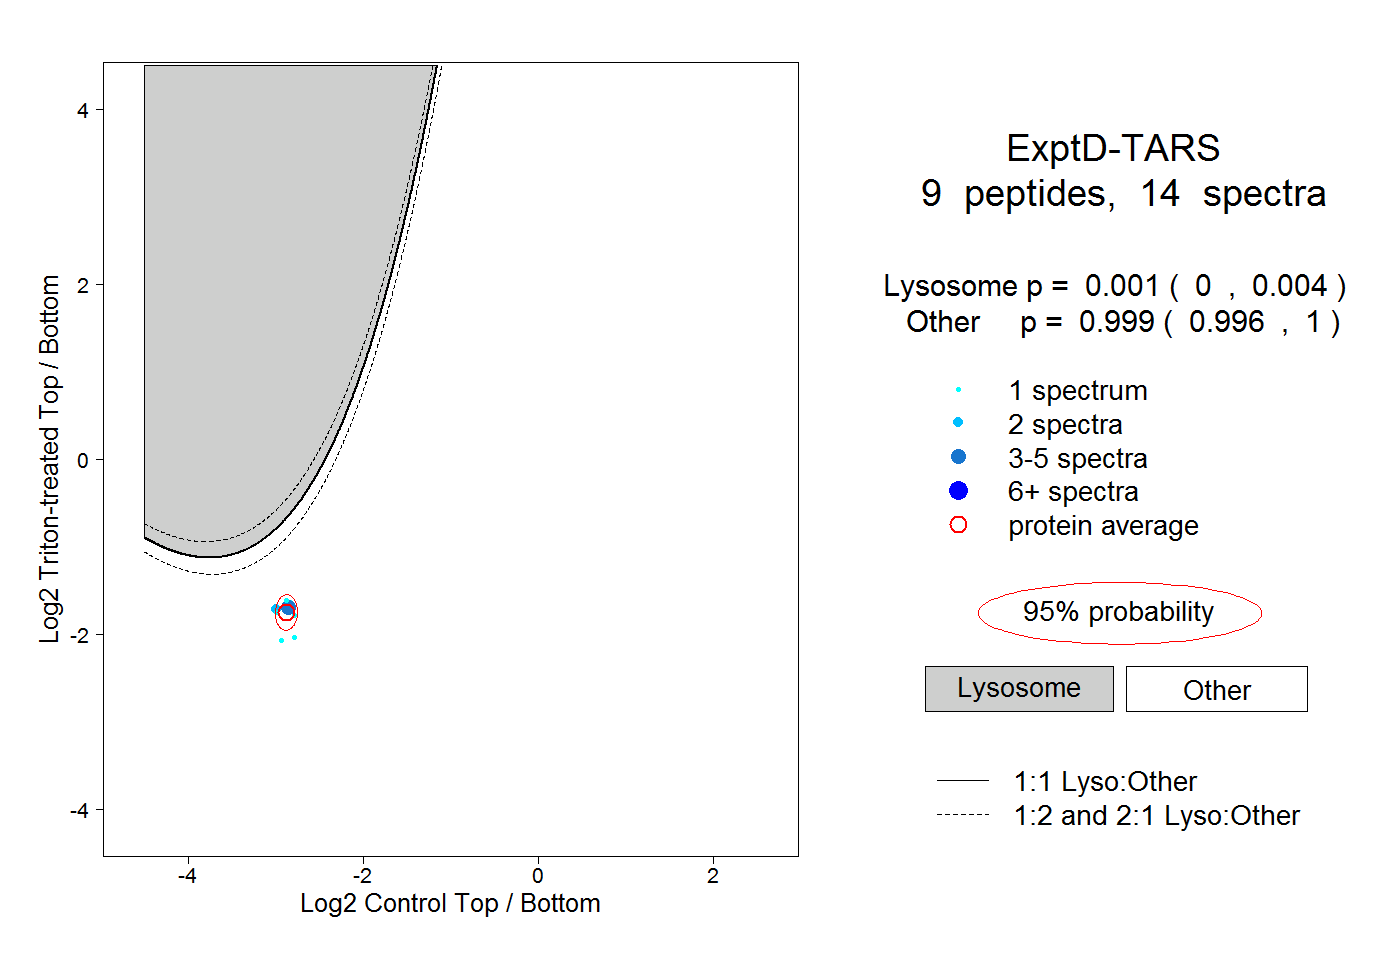
| Expt D |
9
peptides |
14
spectra |
 |
|
0.001
0.000 | 0.004 |
|
|
|
|
|
|
|
0.999
0.996 | 1.000 |
| 2 spectra, ETLLEMFK |
|
0.003 |
|
|
|
|
|
|
|
0.997 |
| 1 spectrum, IYGISFPDPK |
|
0.002 |
|
|
|
|
|
|
|
0.998 |
| 1 spectrum, VNTPTTTVYR |
|
0.003 |
|
|
|
|
|
|
|
0.997 |
| 1 spectrum, DSKPIK |
|
0.000 |
|
|
|
|
|
|
|
1.000 |
| 2 spectra, FQEEAK |
|
0.002 |
|
|
|
|
|
|
|
0.998 |
| 1 spectrum, AILGSVER |
|
0.001 |
|
|
|
|
|
|
|
0.999 |
| 1 spectrum, ASSPSGK |
|
0.000 |
|
|
|
|
|
|
|
1.000 |
| 4 spectra, TVGETVER |
|
0.002 |
|
|
|
|
|
|
|
0.998 |
| 1 spectrum, QVDAESWK |
|
0.002 |
|
|
|
|
|
|
|
0.998 |