 8
8peptides
spectra
0.000 | 0.000
0.000 | 0.000
0.000 | 0.000
0.261 | 0.281
0.000 | 0.000
0.000 | 0.000
0.135 | 0.149
0.575 | 0.594
7peptides
spectra
0.000 | 0.000
1.000 | 1.000
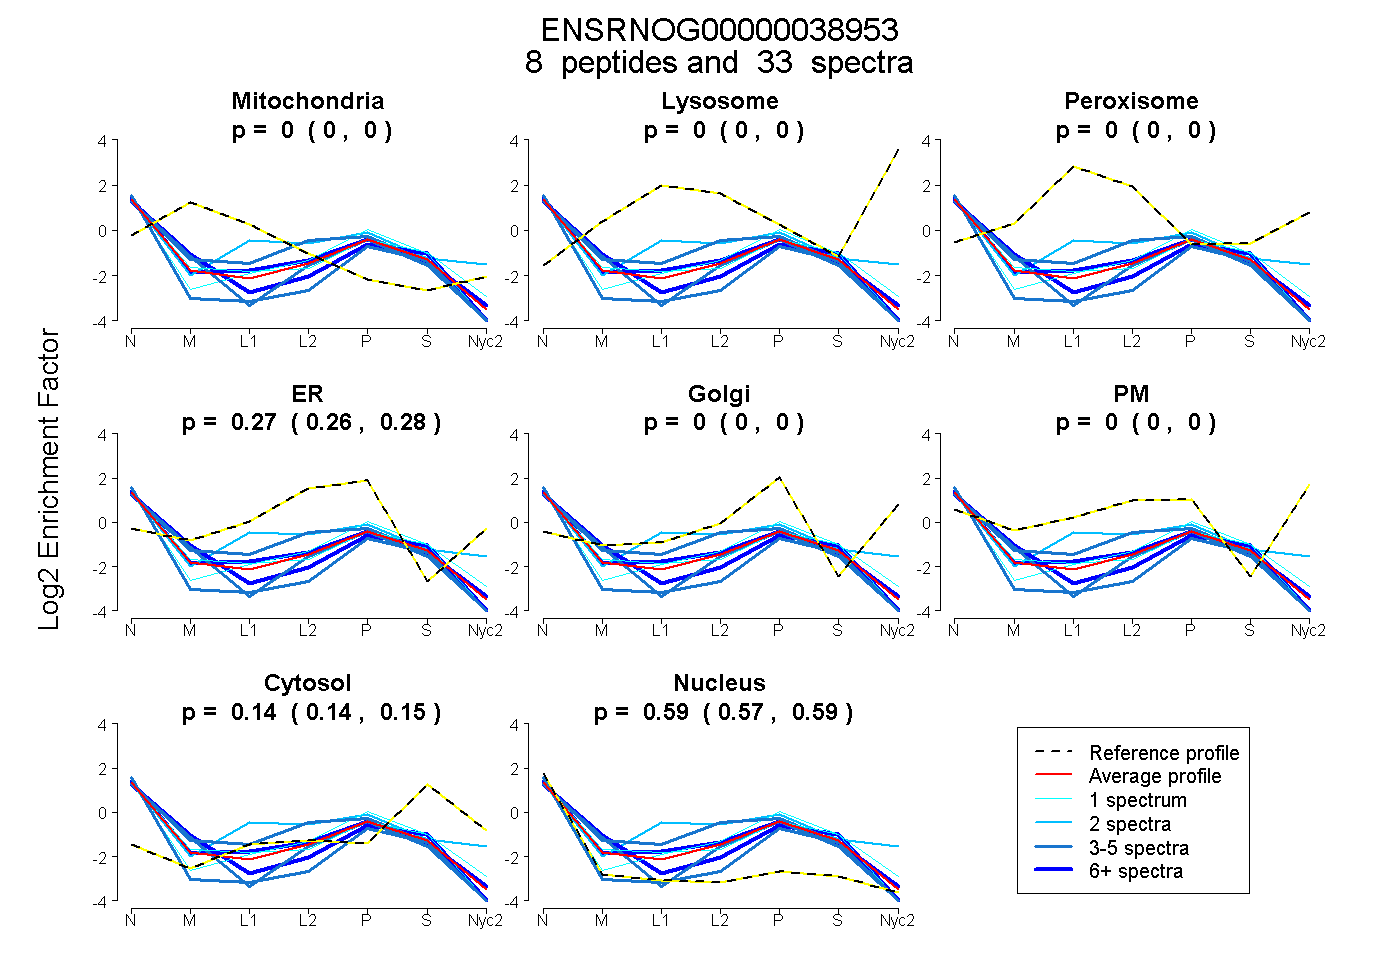
| Plot | Mito | Lyso | Perox | ER | Golgi | PM | Cytosol | Nucleus | |||||
| Expt A |
8 peptides |
33 spectra |
|
0.000 0.000 | 0.000 |
0.000 0.000 | 0.000 |
0.000 0.000 | 0.000 |
0.272 0.261 | 0.281 |
0.000 0.000 | 0.000 |
0.000 0.000 | 0.000 |
0.143 0.135 | 0.149 |
0.585 0.575 | 0.594 |
||
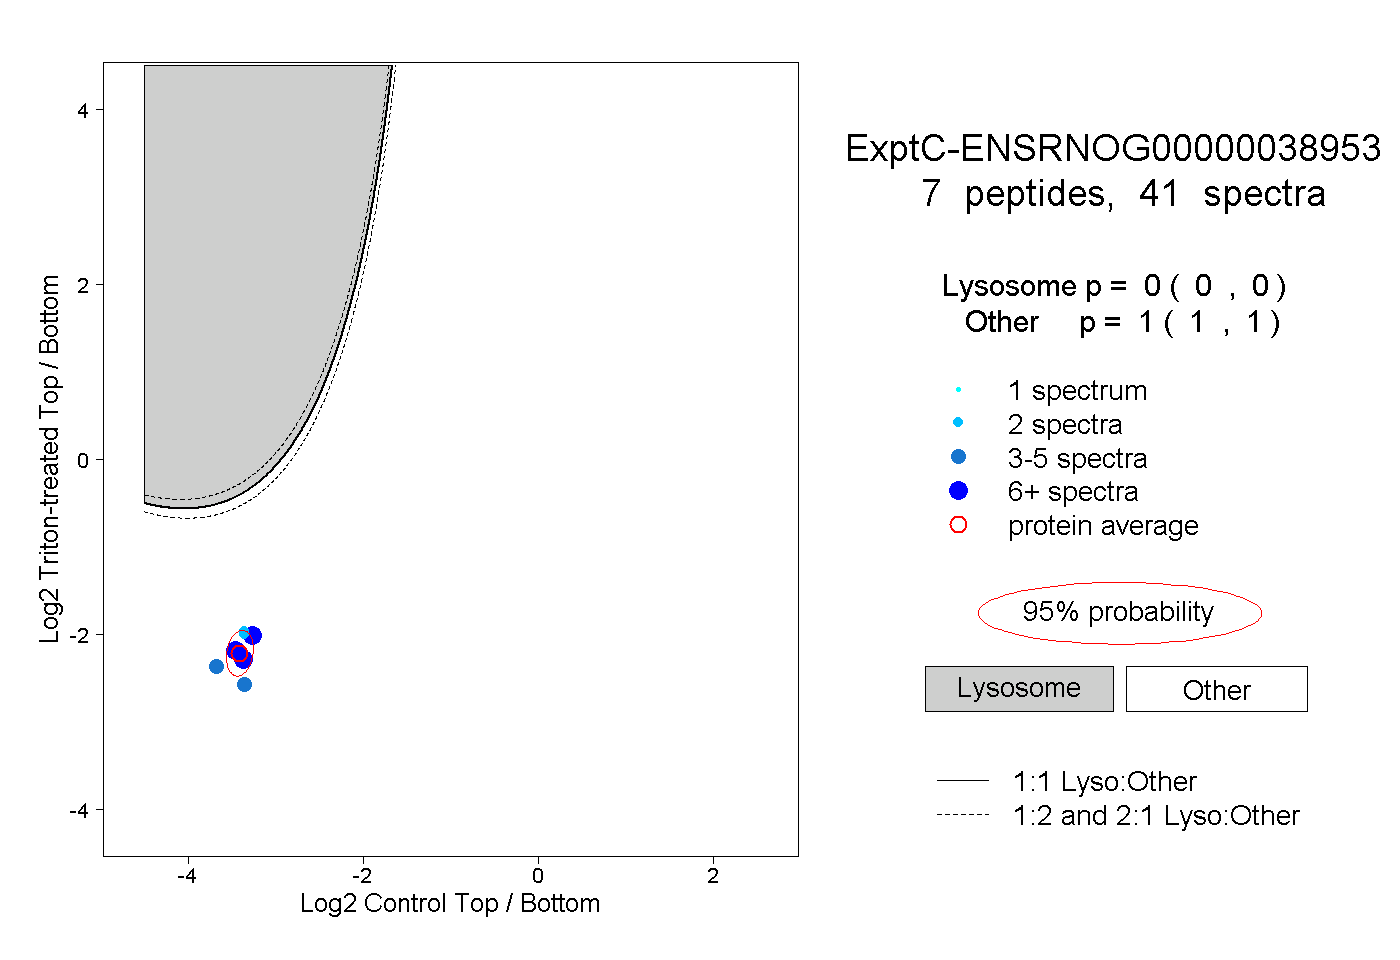
| Plot | Lyso | Other | |||||||||||
| Expt C |
7 peptides |
41 spectra |
|
0.000 0.000 | 0.000 |
1.000 1.000 | 1.000 |