 2
2peptides
spectra
NA | NA
NA | NA
NA | NA
NA | NA
NA | NA
NA | NA
NA | NA
NA | NA
| Plot | Mito | Lyso | Perox | ER | Golgi | PM | Cytosol | Nucleus | |||||
| Expt A |
2 peptides |
2 spectra |
|
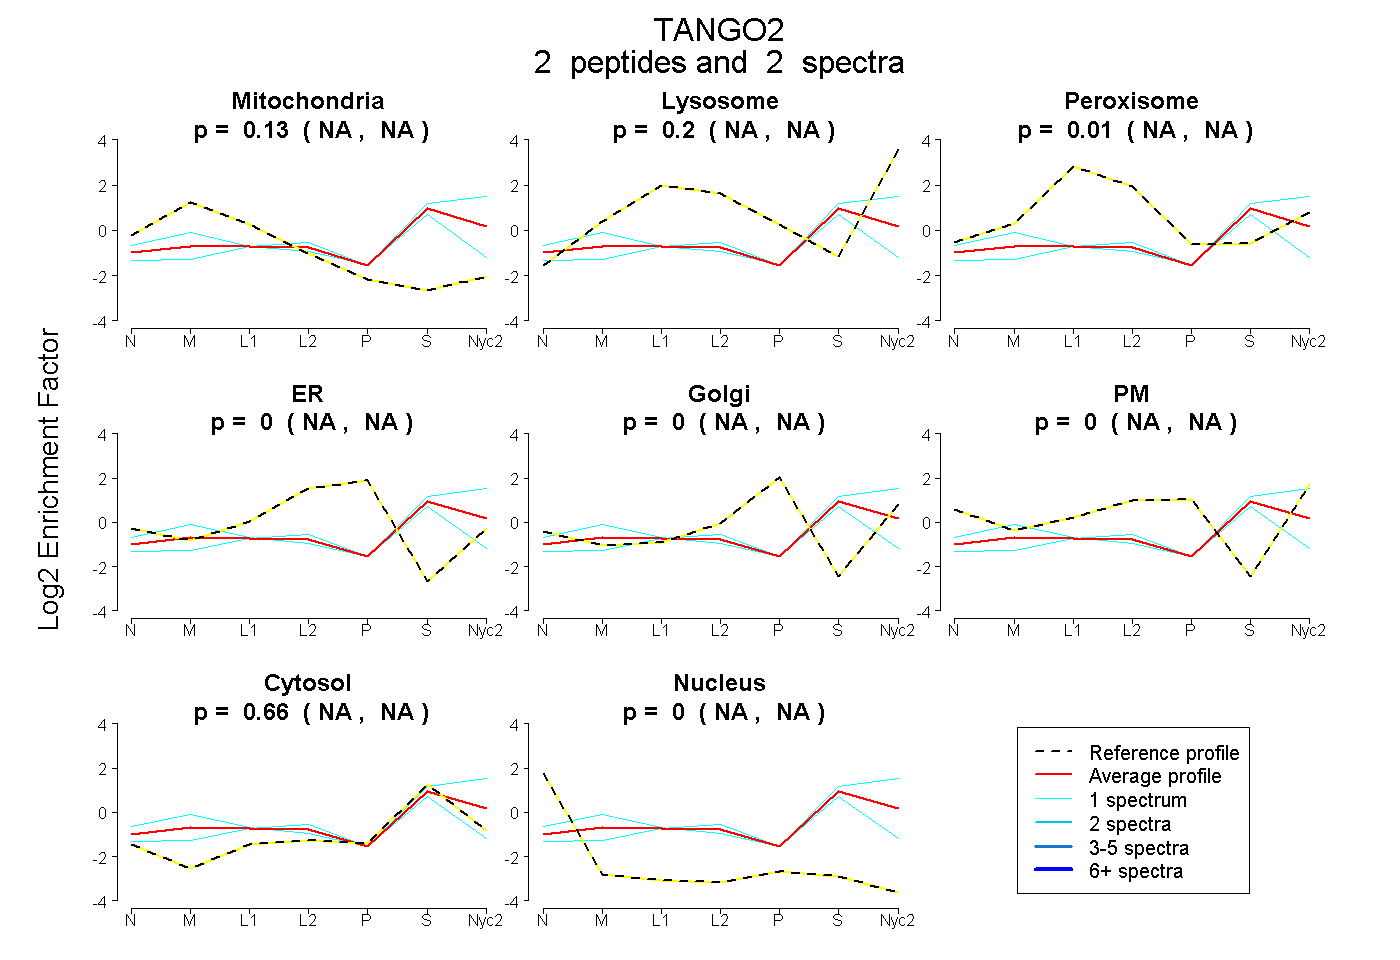
0.134 NA | NA |
0.198 NA | NA |
0.007 NA | NA |
0.000 NA | NA |
0.000 NA | NA |
0.000 NA | NA |
0.661 NA | NA |
0.000 NA | NA |
| 1 spectrum, LGALTNYLQPR | 0.000 | 0.326 | 0.000 | 0.000 | 0.000 | 0.000 | 0.674 | 0.000 | ||
| 1 spectrum, AGGTWLGISTR | 0.328 | 0.000 | 0.092 | 0.000 | 0.000 | 0.000 | 0.580 | 0.000 |