 1
1peptide
spectra
0.000 | 0.000
0.000 | 0.147
0.000 | 0.140
0.000 | 0.352
0.000 | 0.160
0.218 | 0.722
0.138 | 0.318
0.000 | 0.020
3peptides
spectra
0.017 | 0.995
0.005 | 0.983
| Plot | Mito | Lyso | Perox | ER | Golgi | PM | Cytosol | Nucleus | |||||
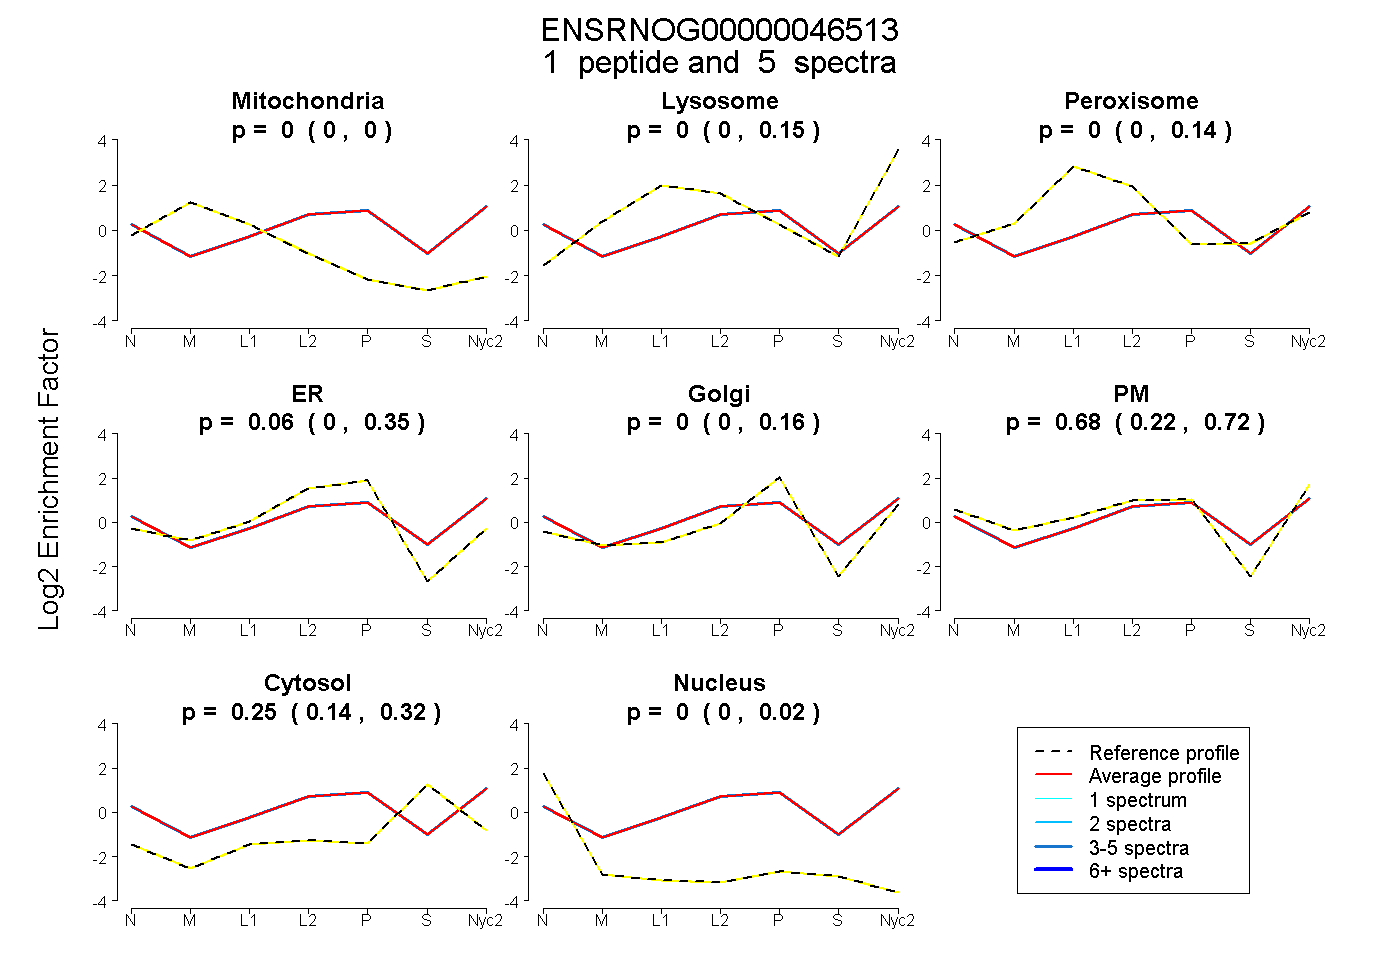
| Expt A |
1 peptide |
5 spectra |
|
0.000 0.000 | 0.000 |
0.003 0.000 | 0.147 |
0.000 0.000 | 0.140 |
0.060 0.000 | 0.352 |
0.000 0.000 | 0.160 |
0.684 0.218 | 0.722 |
0.253 0.138 | 0.318 |
0.000 0.000 | 0.020 |
||
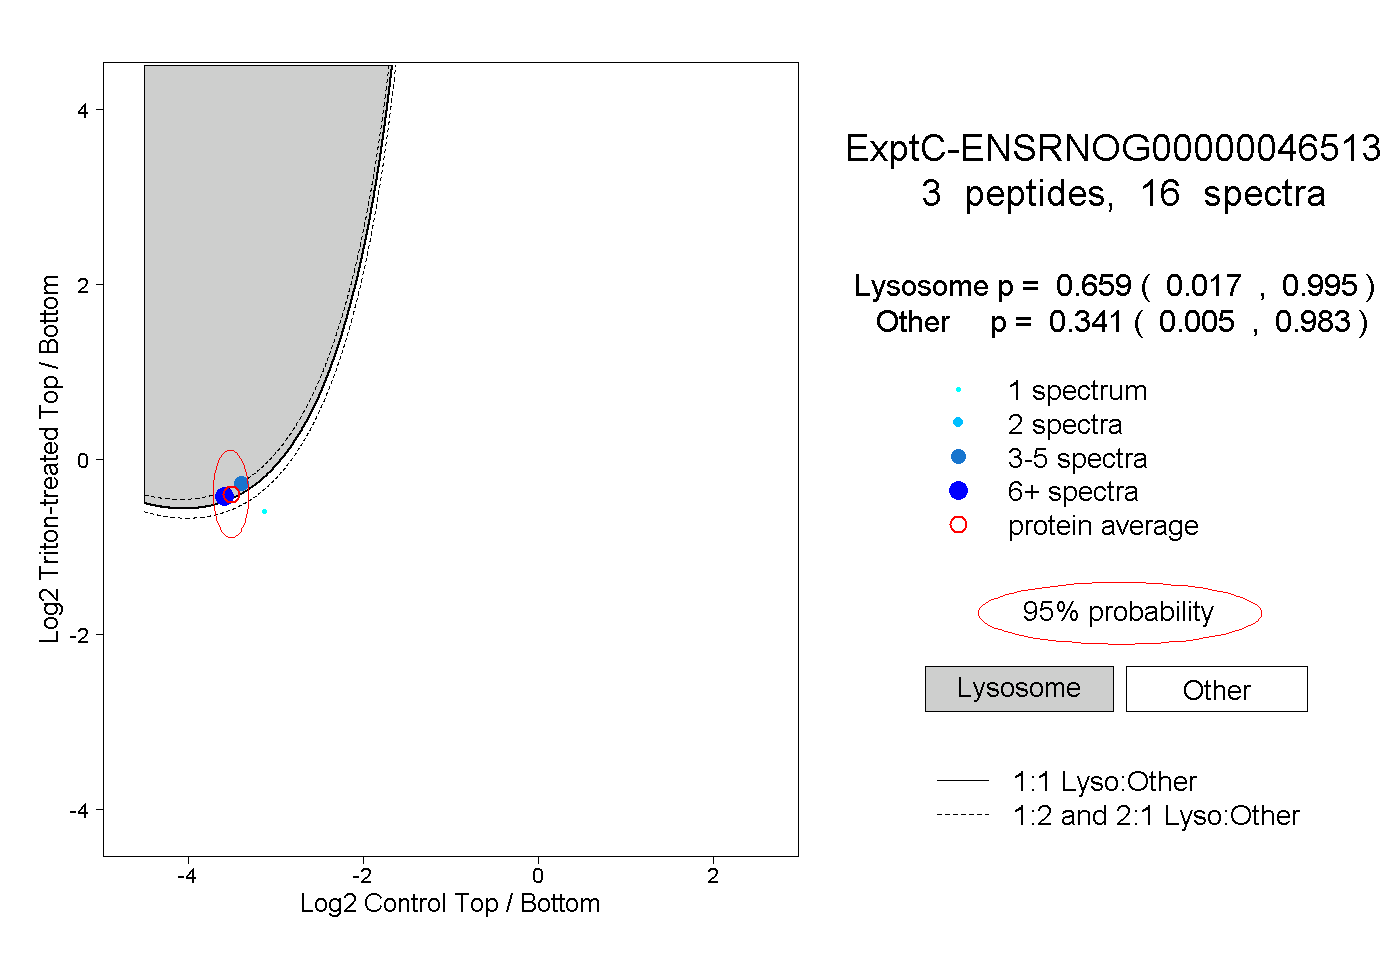
| Plot | Lyso | Other | |||||||||||
| Expt C |
3 peptides |
16 spectra |
|
0.659 0.017 | 0.995 |
0.341 0.005 | 0.983 |
| 4 spectra, ASQNIYK | 0.786 | 0.214 | ||||||||
| 1 spectrum, HGEAPK | 0.018 | 0.982 | ||||||||
| 11 spectra, VTLNCK | 0.675 | 0.325 |