 4
4peptides
spectra
0.000 | 0.000
0.000 | 0.000
0.000 | 0.023
0.077 | 0.305
0.000 | 0.108
0.000 | 0.089
0.490 | 0.588
0.113 | 0.238
1peptide
spectra
0.000 | 0.000
1.000 | 1.000
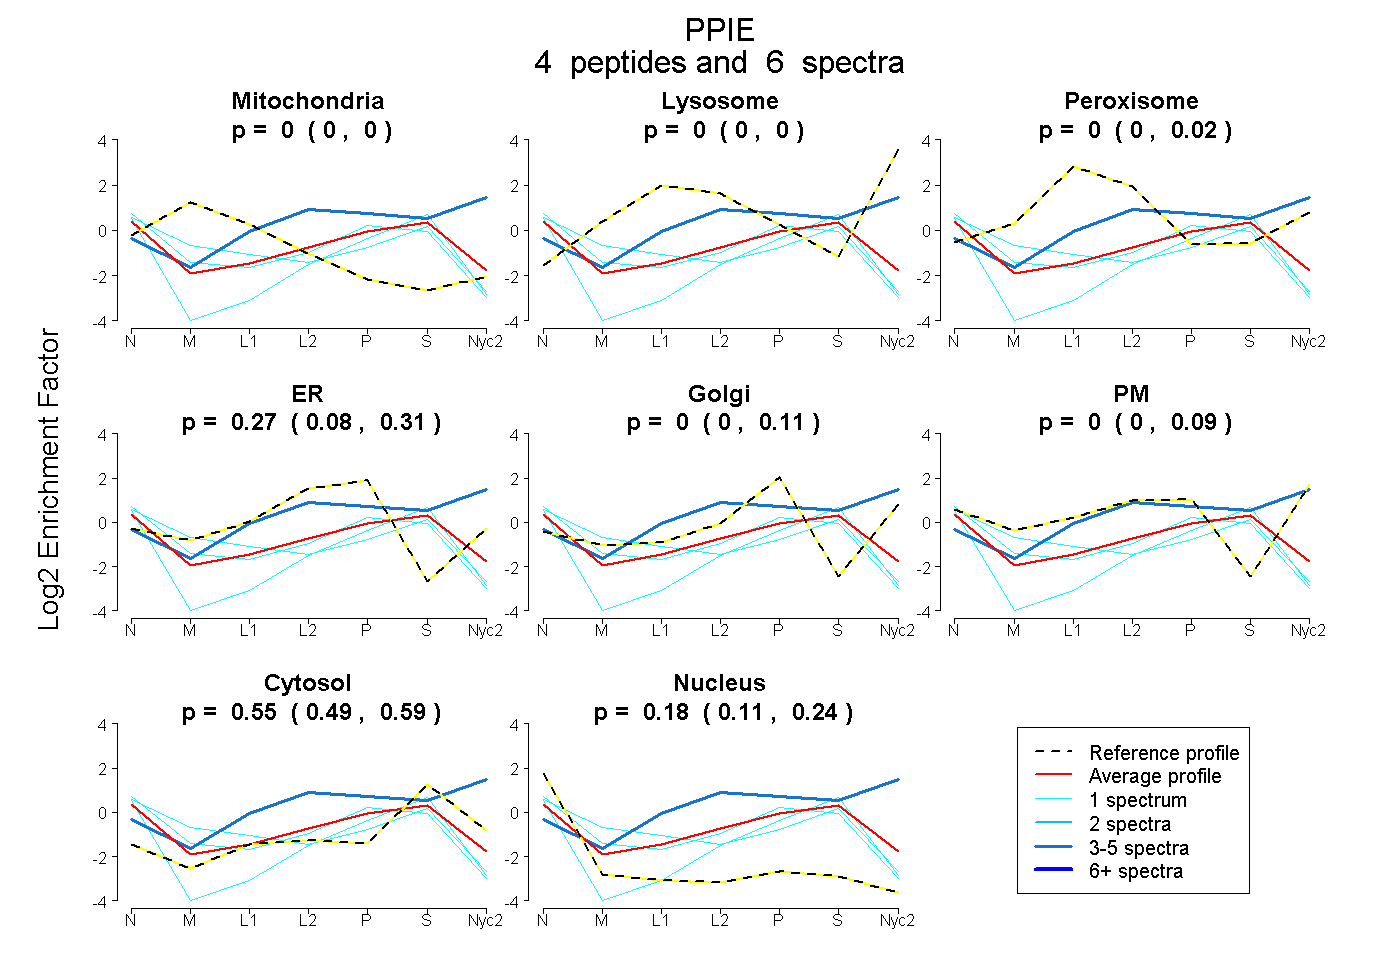
| Plot | Mito | Lyso | Perox | ER | Golgi | PM | Cytosol | Nucleus | |||||
| Expt A |
4 peptides |
6 spectra |
|
0.000 0.000 | 0.000 |
0.000 0.000 | 0.000 |
0.000 0.000 | 0.023 |
0.270 0.077 | 0.305 |
0.000 0.000 | 0.108 |
0.000 0.000 | 0.089 |
0.549 0.490 | 0.588 |
0.180 0.113 | 0.238 |
||
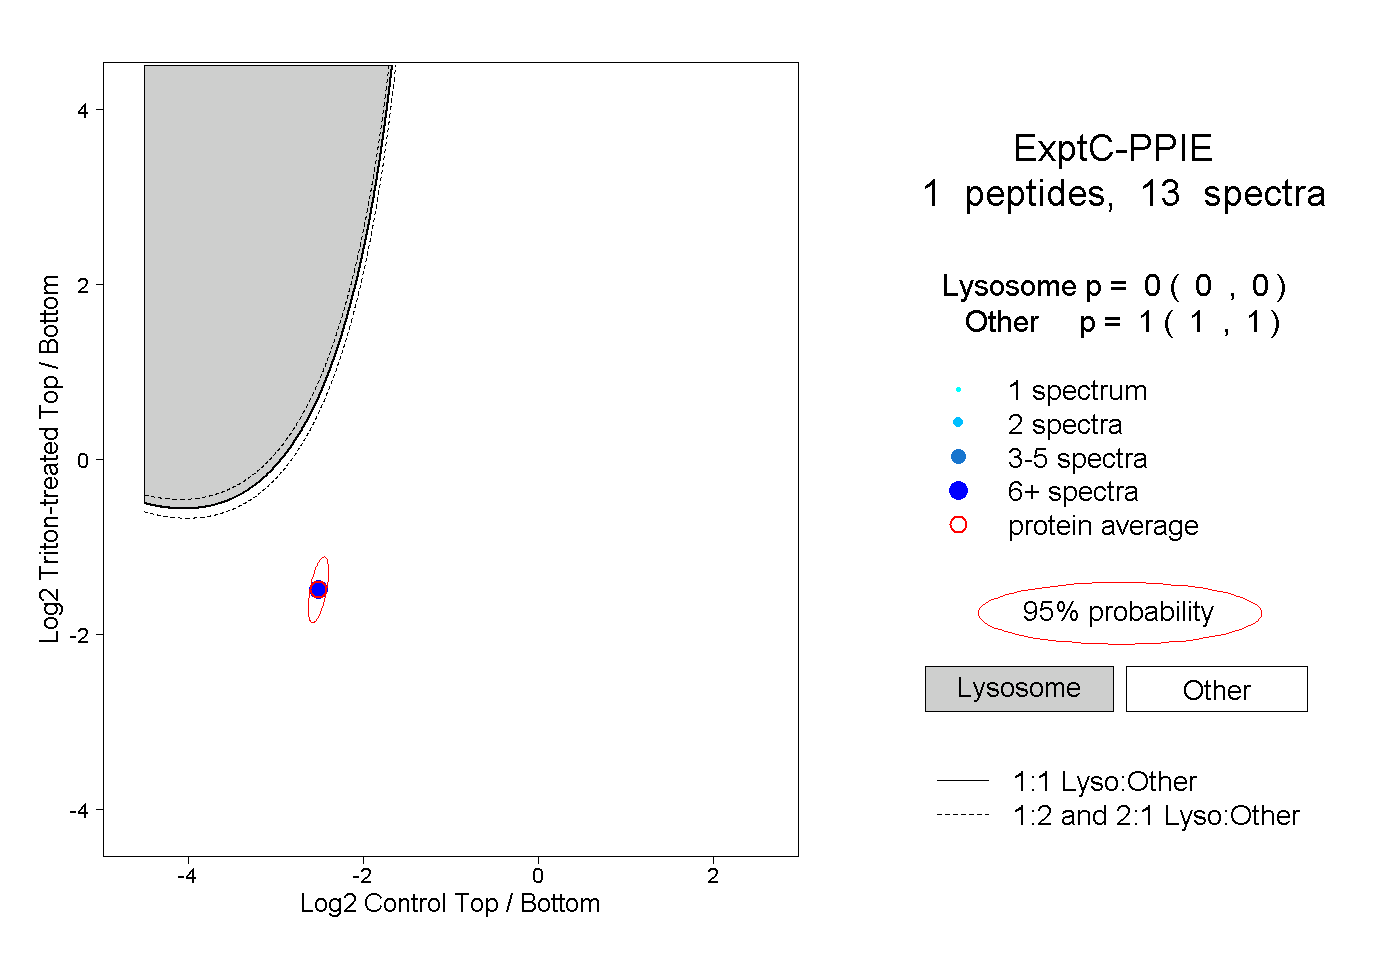
| Plot | Lyso | Other | |||||||||||
| Expt C |
1 peptide |
13 spectra |
|
0.000 0.000 | 0.000 |
1.000 1.000 | 1.000 |