 2
2peptides
spectra
0.000 | 0.000
0.469 | 0.680
0.000 | 0.015
0.000 | 0.000
0.000 | 0.079
0.000 | 0.164
0.253 | 0.359
0.000 | 0.000
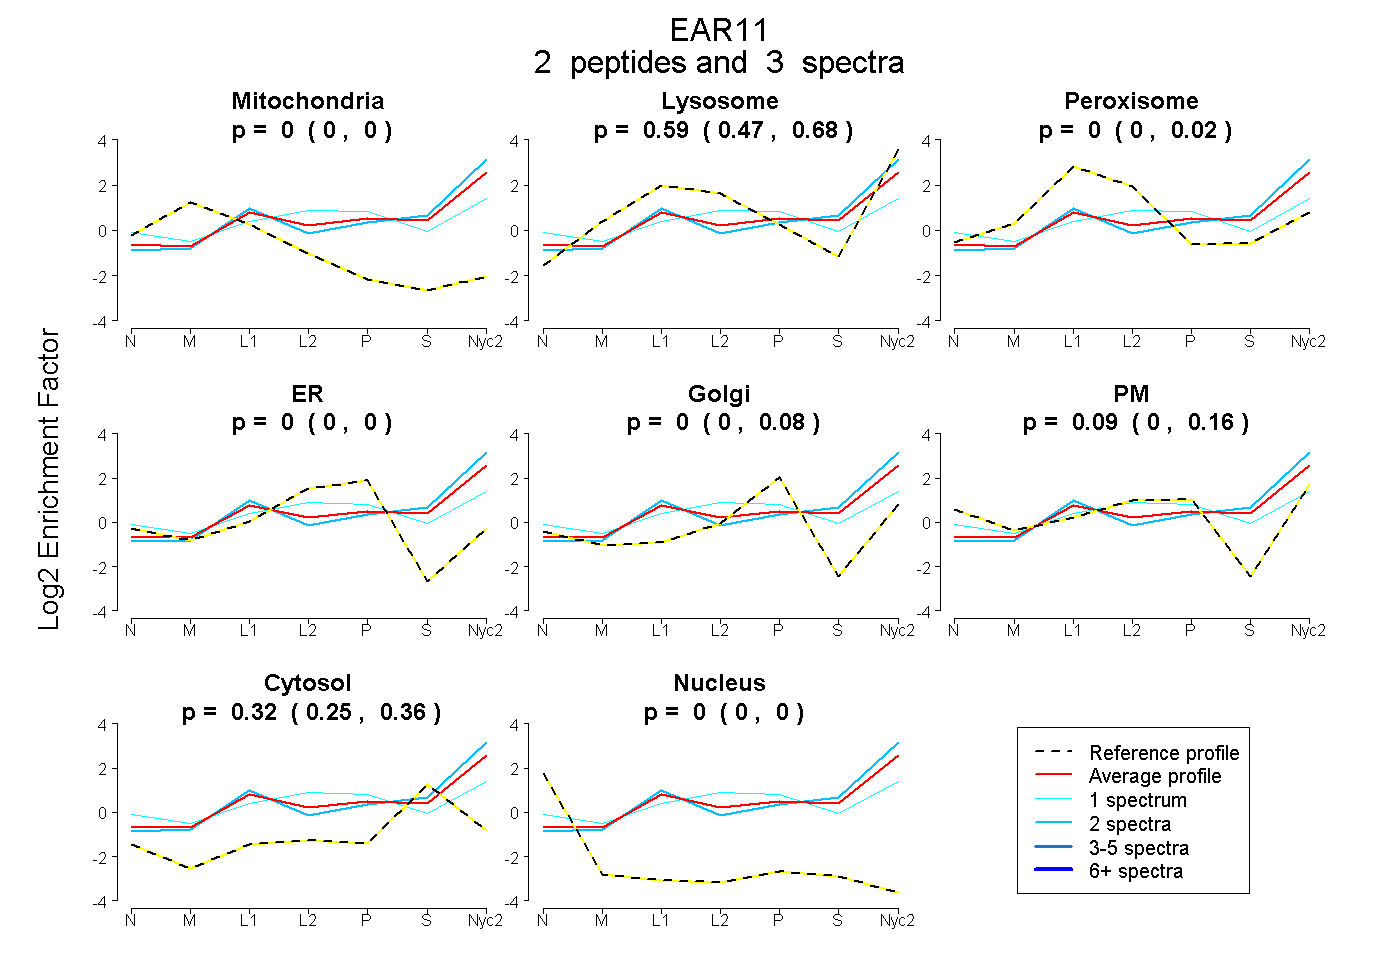
| Plot | Mito | Lyso | Perox | ER | Golgi | PM | Cytosol | Nucleus | |||||
| Expt A |
2 peptides |
3 spectra |
|
0.000 0.000 | 0.000 |
0.591 0.469 | 0.680 |
0.000 0.000 | 0.015 |
0.000 0.000 | 0.000 |
0.000 0.000 | 0.079 |
0.092 0.000 | 0.164 |
0.317 0.253 | 0.359 |
0.000 0.000 | 0.000 |
| 1 spectrum, IYTQCR | 0.000 | 0.200 | 0.153 | 0.000 | 0.037 | 0.370 | 0.239 | 0.000 | ||
| 2 spectra, DSPMYPVVPVHLDR | 0.000 | 0.680 | 0.000 | 0.000 | 0.000 | 0.000 | 0.320 | 0.000 |