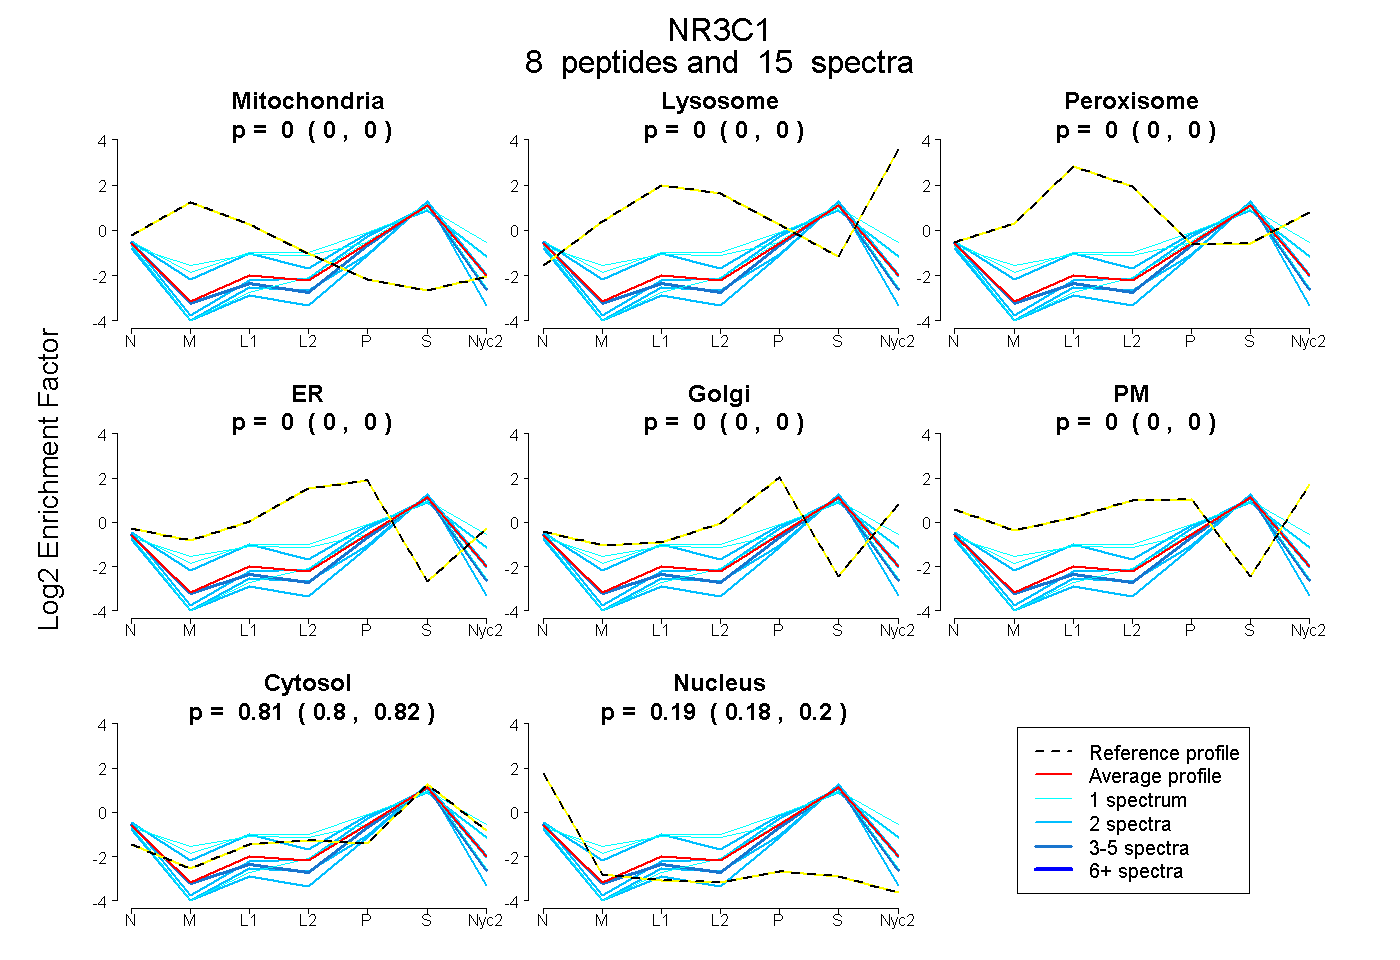
 8
8peptides
spectra
0.000 | 0.000
0.000 | 0.000
0.000 | 0.000
0.000 | 0.000
0.000 | 0.000
0.000 | 0.000
0.795 | 0.820
0.179 | 0.202
| Plot | Mito | Lyso | Perox | ER | Golgi | PM | Cytosol | Nucleus | |||||
| Expt A |
8 peptides |
15 spectra |
|
0.000 0.000 | 0.000 |
0.000 0.000 | 0.000 |
0.000 0.000 | 0.000 |
0.000 0.000 | 0.000 |
0.000 0.000 | 0.000 |
0.000 0.000 | 0.000 |
0.808 0.795 | 0.820 |
0.192 0.179 | 0.202 |
| 1 spectrum, NDCIIDK | 0.000 | 0.000 | 0.000 | 0.221 | 0.000 | 0.000 | 0.758 | 0.021 | ||
| 1 spectrum, SSTSATGCATPTEK | 0.024 | 0.000 | 0.041 | 0.000 | 0.086 | 0.077 | 0.771 | 0.000 | ||
| 2 spectra, LLEESIANLNR | 0.000 | 0.000 | 0.000 | 0.000 | 0.000 | 0.000 | 0.780 | 0.220 | ||
| 1 spectrum, TLLLLSSVPK | 0.000 | 0.000 | 0.000 | 0.000 | 0.000 | 0.000 | 0.755 | 0.245 | ||
| 4 spectra, SQELFDEIR | 0.000 | 0.000 | 0.000 | 0.000 | 0.000 | 0.000 | 0.727 | 0.273 | ||
| 2 spectra, ALPGFR | 0.000 | 0.000 | 0.000 | 0.000 | 0.184 | 0.000 | 0.752 | 0.064 | ||
| 2 spectra, LLFHQK | 0.000 | 0.000 | 0.000 | 0.000 | 0.000 | 0.000 | 0.794 | 0.206 | ||
| 2 spectra, GSTSNVQQR | 0.000 | 0.000 | 0.000 | 0.000 | 0.000 | 0.000 | 0.640 | 0.360 |
| Plot | Mito | Lyso or Perox | ER | Golgi | PM | Cytosol | Nucleus | ||||||
| Expt B |
1 peptide |
2 spectra |
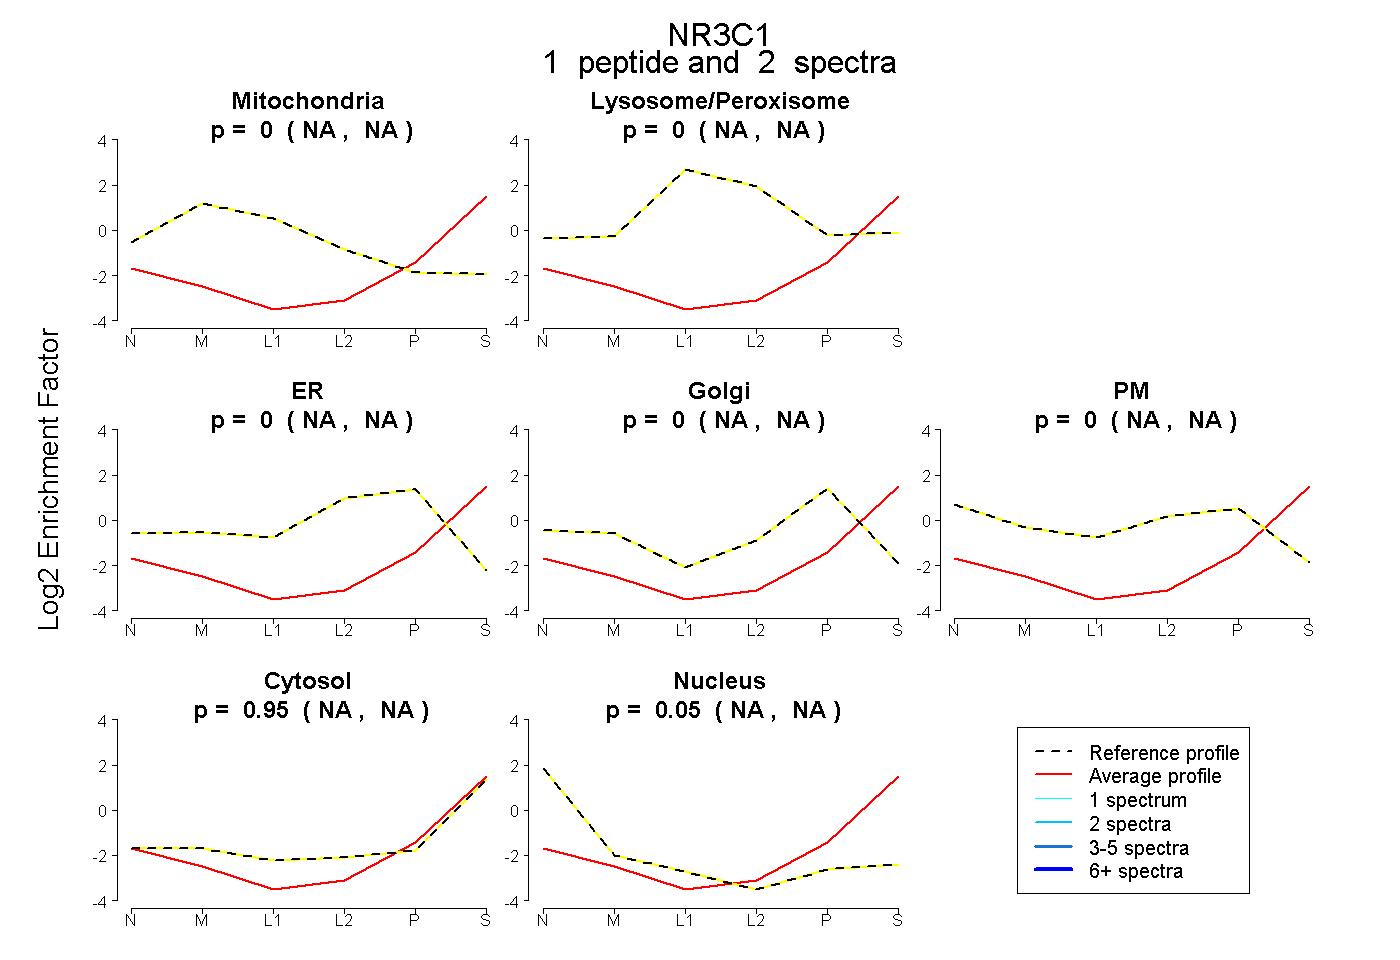 |
0.000 NA | NA |
0.000 NA | NA |
0.000 NA | NA |
0.000 NA | NA |
0.000 NA | NA |
0.950 NA | NA |
0.050 NA | NA |
|||
| Plot | Lyso | Other | |||||||||||
| Expt C |
3 peptides |
4 spectra |
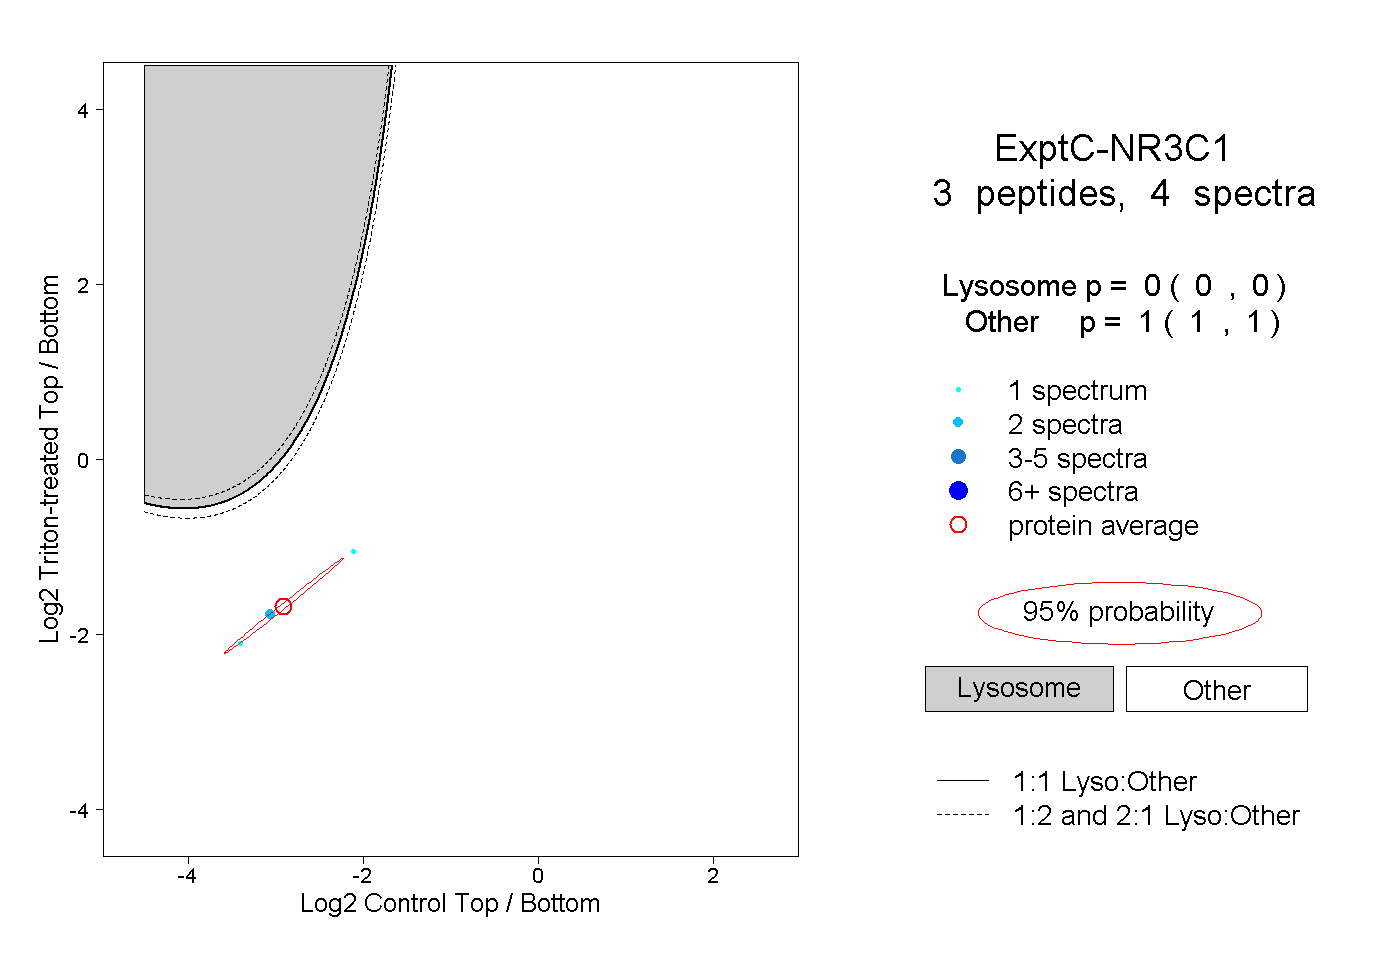 |
0.000 0.000 | 0.000 |
1.000 1.000 | 1.000 |