19
19peptides
spectra
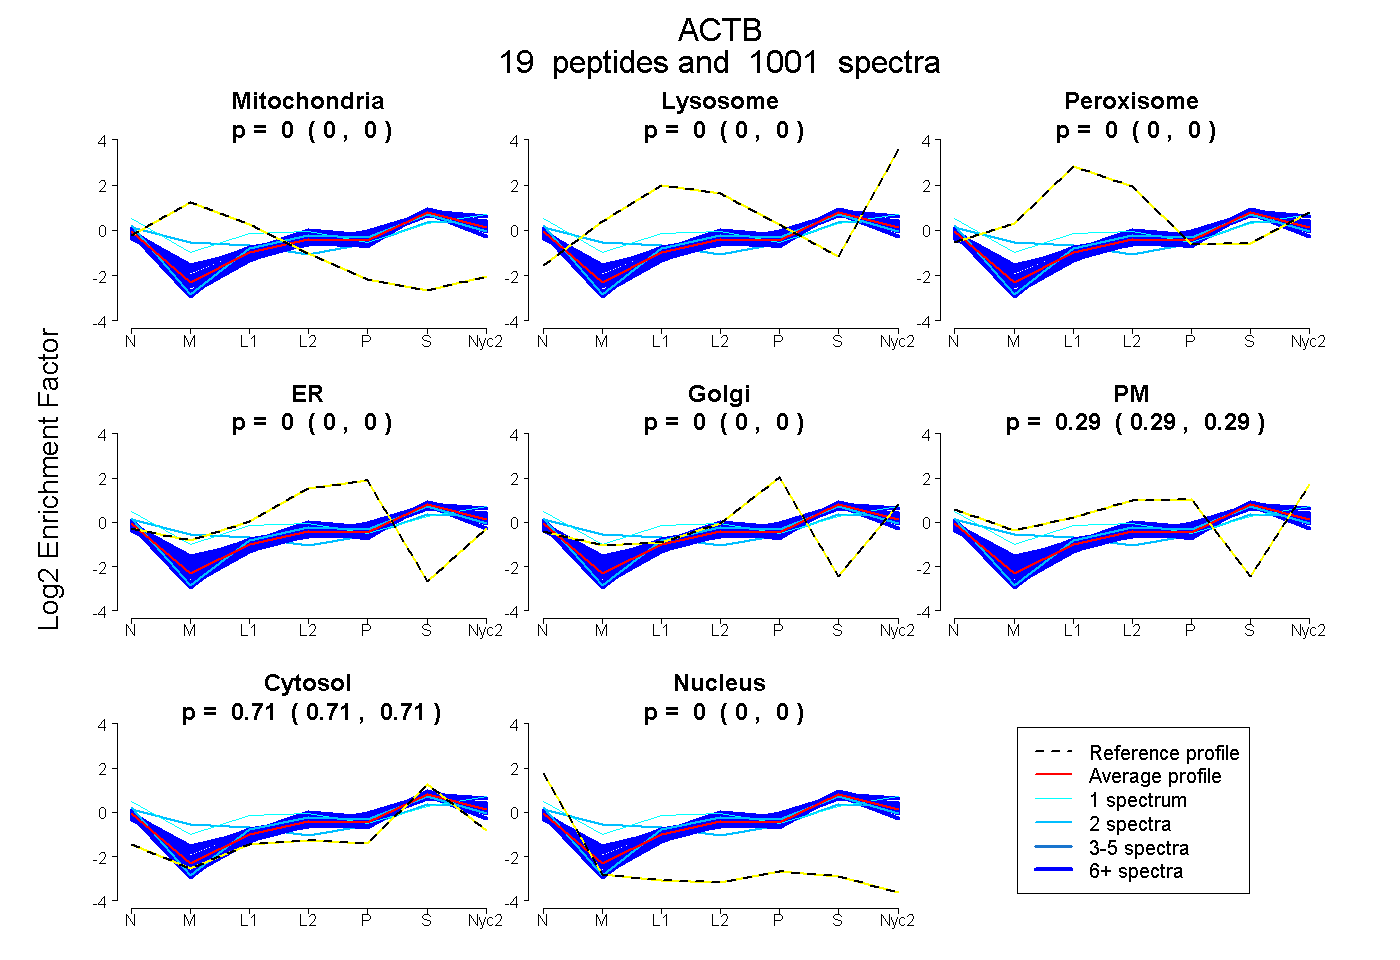
0.000 | 0.000
0.000 | 0.000
0.000 | 0.000
0.000 | 0.000
0.000 | 0.000
0.291 | 0.292
0.708 | 0.709
0.000 | 0.000
15peptides
spectra
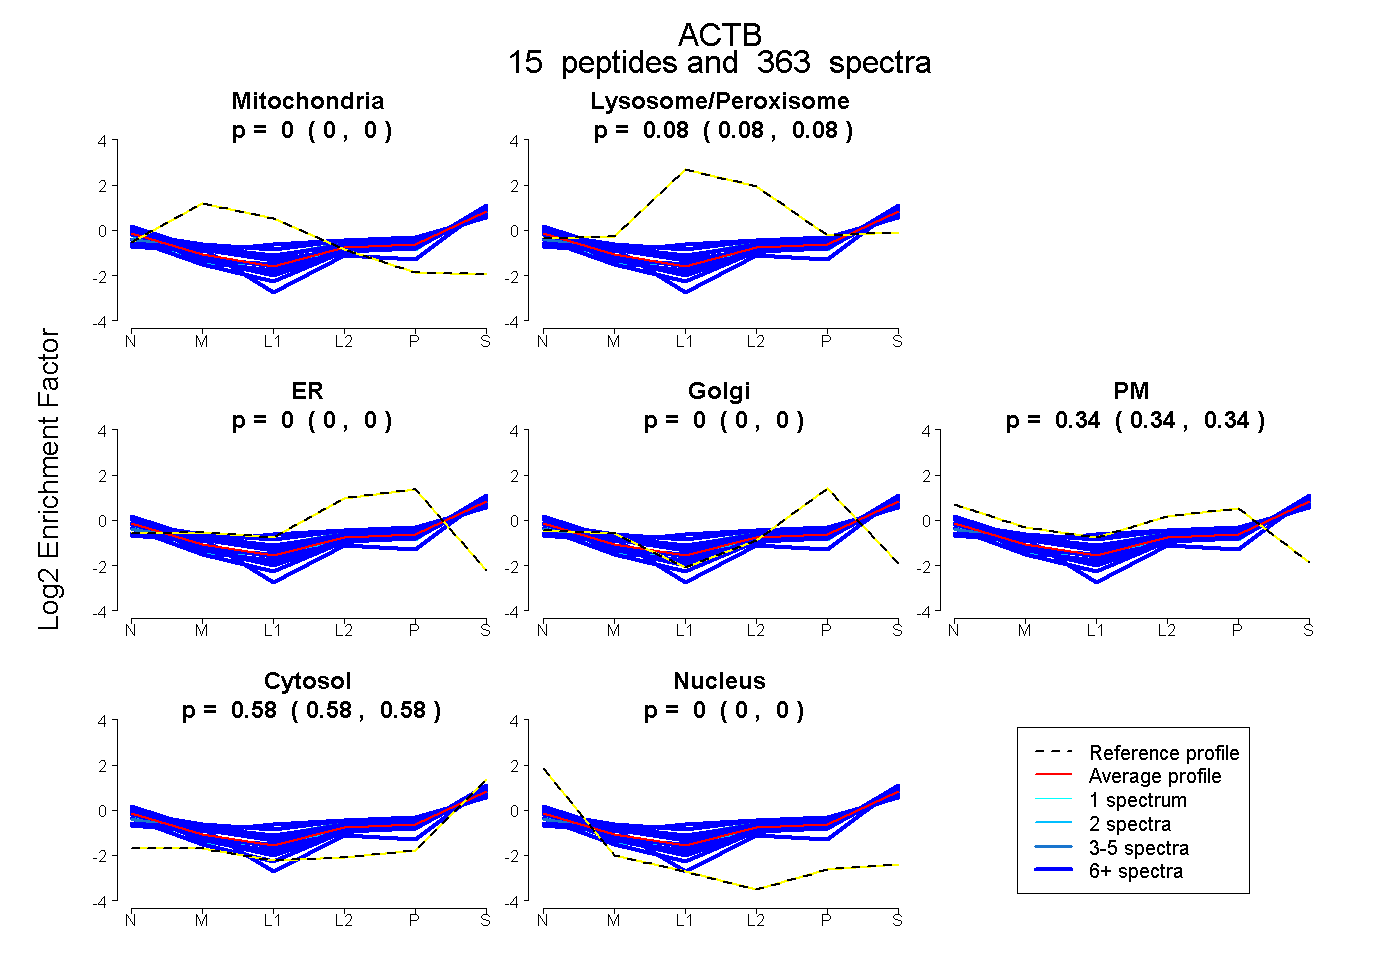
0.000 | 0.000
0.076 | 0.081
0.000 | 0.000
0.000 | 0.000
0.339 | 0.343
0.578 | 0.581
0.000 | 0.000
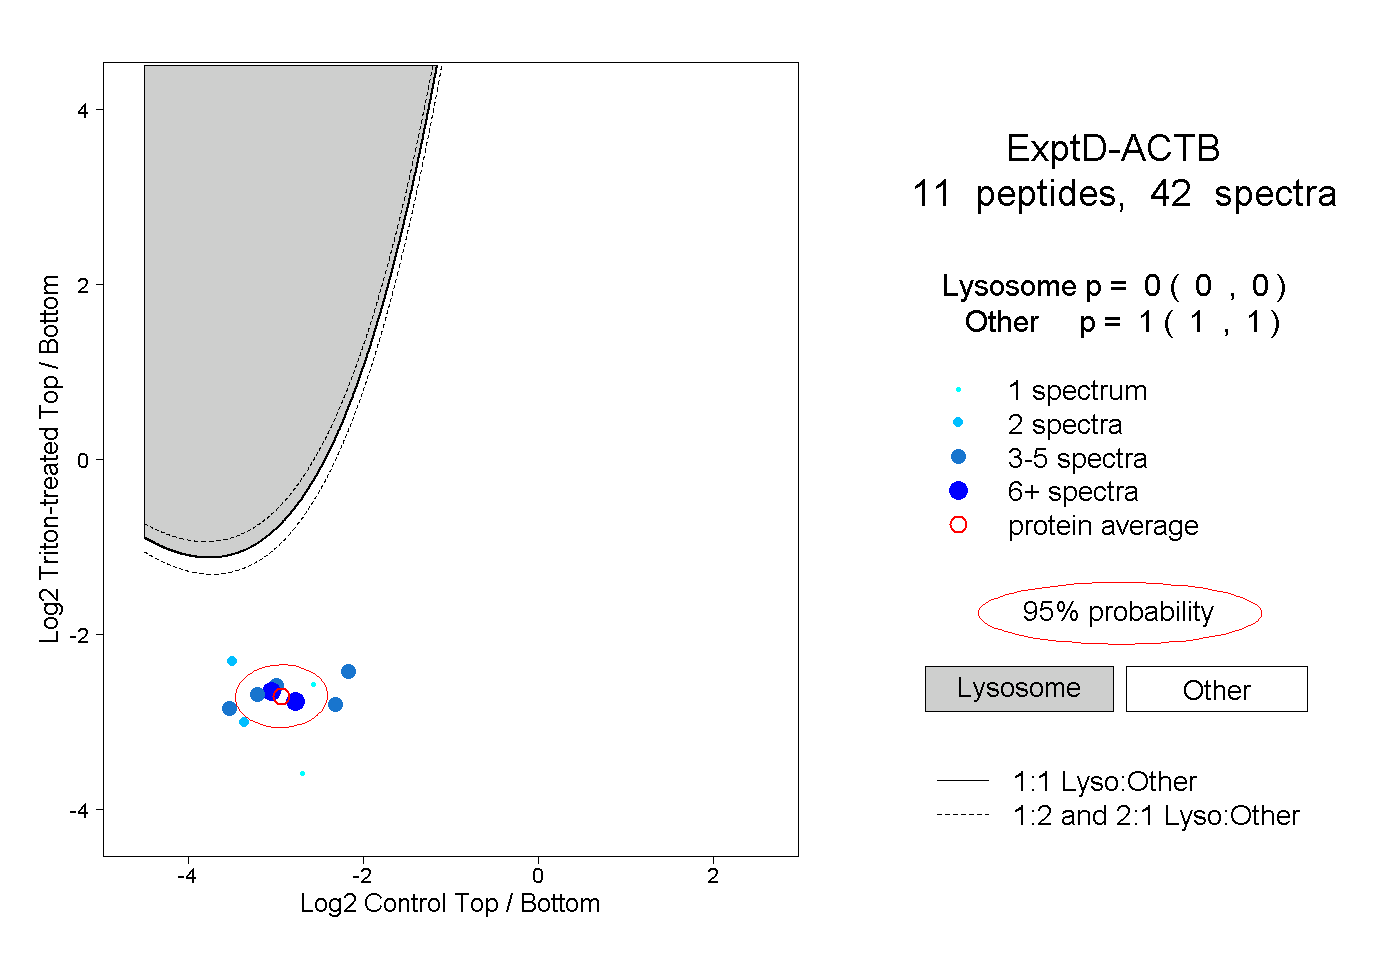
17peptides
spectra
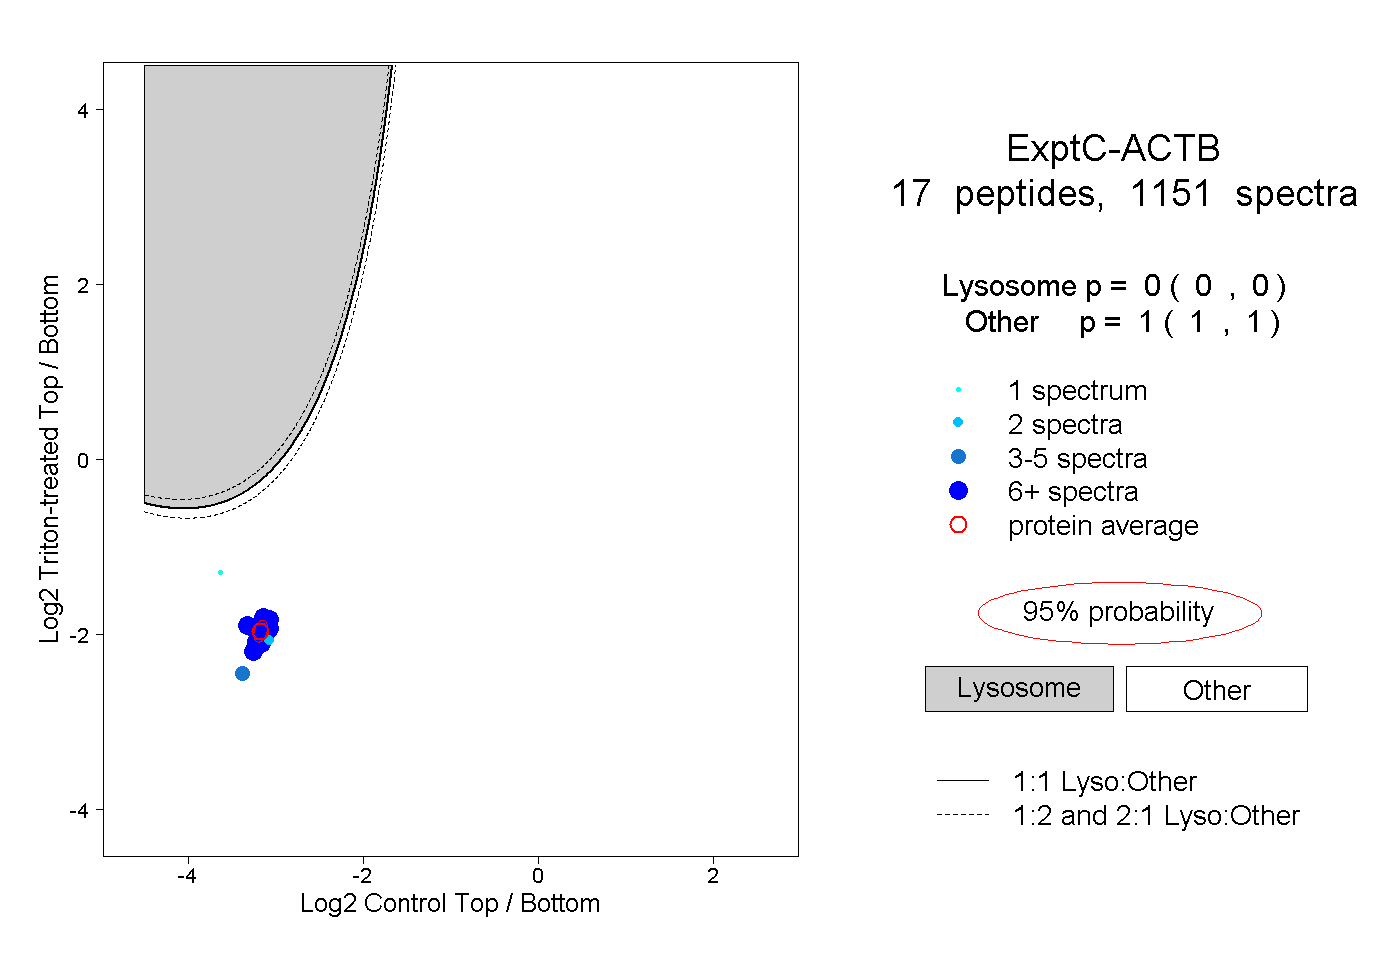
0.000 | 0.000
1.000 | 1.000