 19
19peptides
spectra
0.000 | 0.000
0.000 | 0.000
0.000 | 0.000
0.000 | 0.000
0.000 | 0.000
0.291 | 0.292
0.708 | 0.709
0.000 | 0.000
| Plot | Mito | Lyso | Perox | ER | Golgi | PM | Cytosol | Nucleus | |||||
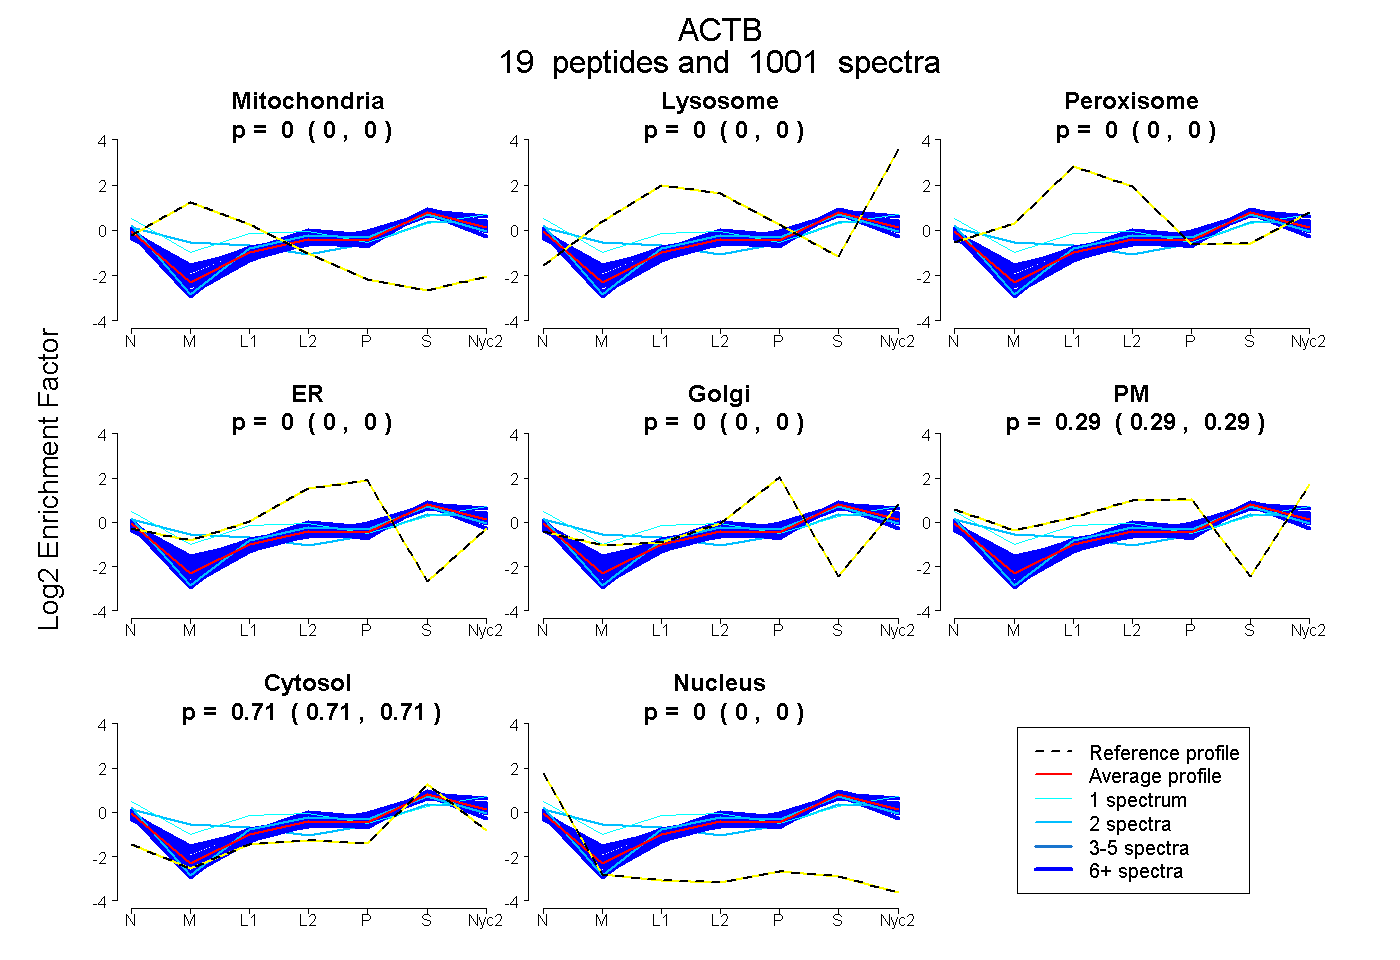
| Expt A |
19 peptides |
1001 spectra |
|
0.000 0.000 | 0.000 |
0.000 0.000 | 0.000 |
0.000 0.000 | 0.000 |
0.000 0.000 | 0.000 |
0.000 0.000 | 0.000 |
0.291 0.291 | 0.292 |
0.709 0.708 | 0.709 |
0.000 0.000 | 0.000 |
| 78 spectra, DLTDYLMK | 0.000 | 0.000 | 0.001 | 0.000 | 0.000 | 0.303 | 0.696 | 0.000 | ||
| 6 spectra, DLYANTVLSGGTTMYPGIADR | 0.000 | 0.000 | 0.000 | 0.000 | 0.000 | 0.221 | 0.779 | 0.000 | ||
| 2 spectra, YPIEHGIVTNWDDMEK | 0.000 | 0.000 | 0.000 | 0.000 | 0.000 | 0.294 | 0.706 | 0.000 | ||
| 42 spectra, LDIAGR | 0.000 | 0.000 | 0.000 | 0.000 | 0.000 | 0.262 | 0.728 | 0.010 | ||
| 47 spectra, QEYDESGPSIVHR | 0.000 | 0.000 | 0.000 | 0.000 | 0.000 | 0.312 | 0.688 | 0.000 | ||
| 110 spectra, HQGVMVGMGQK | 0.000 | 0.064 | 0.000 | 0.000 | 0.000 | 0.292 | 0.644 | 0.000 | ||
| 14 spectra, IWHHTFYNELR | 0.000 | 0.016 | 0.007 | 0.000 | 0.000 | 0.316 | 0.661 | 0.000 | ||
| 142 spectra, AGFAGDDAPR | 0.000 | 0.000 | 0.000 | 0.000 | 0.000 | 0.271 | 0.729 | 0.000 | ||
| 1 spectrum, VSYADDEAQSK | 0.000 | 0.000 | 0.181 | 0.000 | 0.000 | 0.361 | 0.456 | 0.001 | ||
| 114 spectra, GYSFTTTAER | 0.000 | 0.000 | 0.000 | 0.000 | 0.000 | 0.256 | 0.744 | 0.000 | ||
| 47 spectra, EITALAPSTMK | 0.000 | 0.000 | 0.022 | 0.000 | 0.000 | 0.346 | 0.633 | 0.000 | ||
| 13 spectra, VAPEEHPVLLTEAPLNPK | 0.000 | 0.000 | 0.000 | 0.000 | 0.000 | 0.231 | 0.764 | 0.004 | ||
| 52 spectra, CDVDIR | 0.000 | 0.000 | 0.065 | 0.022 | 0.000 | 0.257 | 0.656 | 0.000 | ||
| 68 spectra, IIAPPER | 0.000 | 0.000 | 0.000 | 0.000 | 0.000 | 0.243 | 0.757 | 0.000 | ||
| 58 spectra, SYELPDGQVITIGNER | 0.000 | 0.000 | 0.000 | 0.000 | 0.000 | 0.256 | 0.736 | 0.008 | ||
| 68 spectra, DSYVGDEAQSK | 0.000 | 0.000 | 0.000 | 0.000 | 0.000 | 0.256 | 0.744 | 0.000 | ||
| 12 spectra, GILTLK | 0.000 | 0.000 | 0.000 | 0.000 | 0.000 | 0.253 | 0.747 | 0.000 | ||
| 125 spectra, AVFPSIVGRPR | 0.000 | 0.000 | 0.000 | 0.000 | 0.000 | 0.284 | 0.716 | 0.000 | ||
| 2 spectra, DLTDYFMK | 0.121 | 0.037 | 0.000 | 0.000 | 0.000 | 0.310 | 0.532 | 0.000 |
| Plot | Mito | Lyso or Perox | ER | Golgi | PM | Cytosol | Nucleus | ||||||
| Expt B |
15 peptides |
363 spectra |
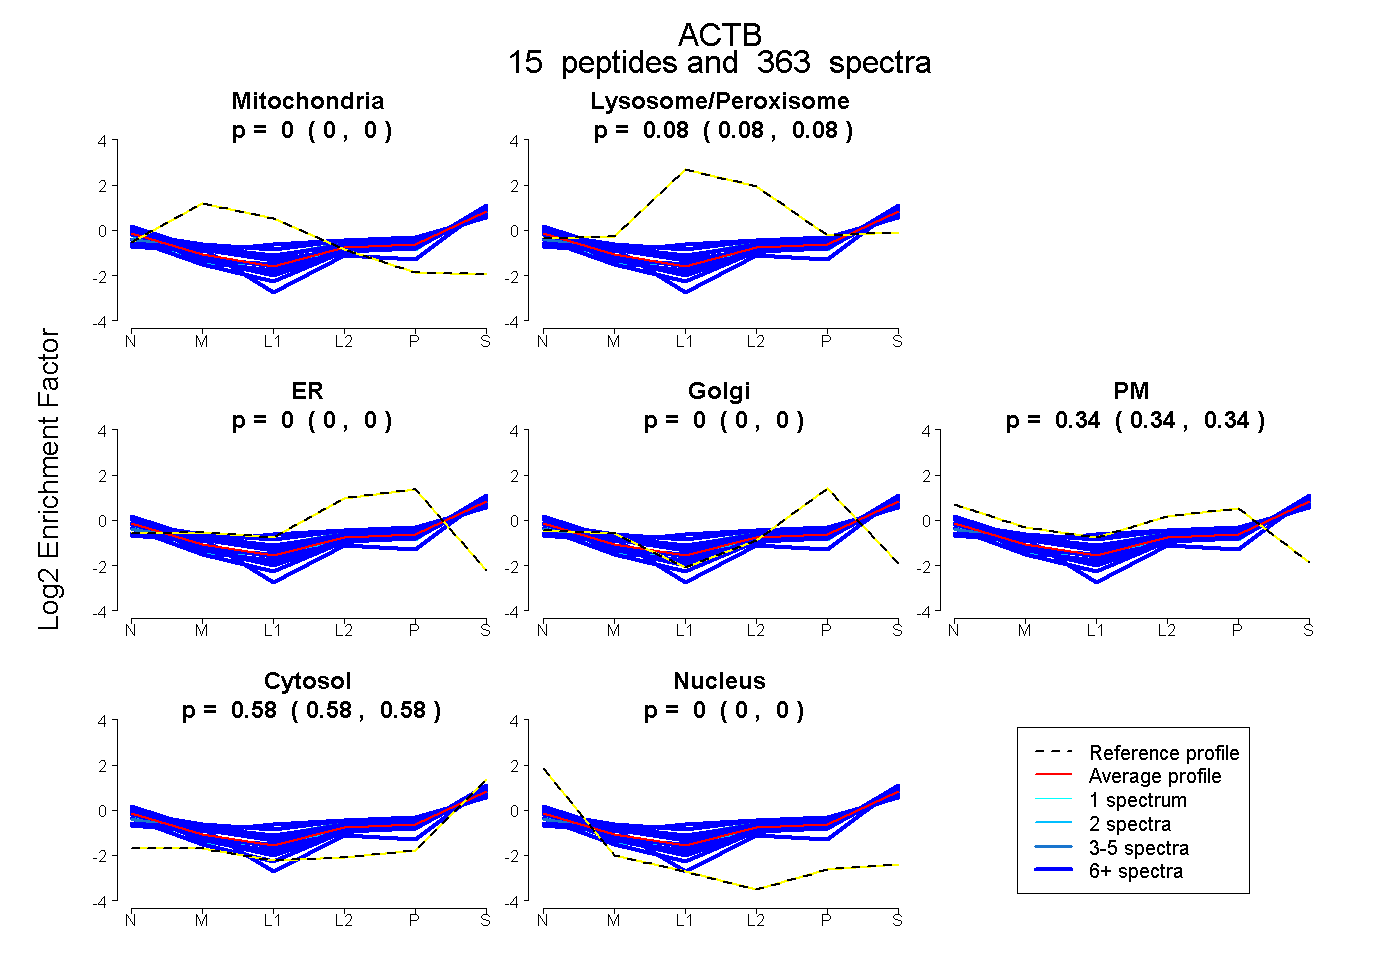 |
0.000 0.000 | 0.000 |
0.079 0.076 | 0.081 |
0.000 0.000 | 0.000 |
0.000 0.000 | 0.000 |
0.342 0.339 | 0.343 |
0.580 0.578 | 0.581 |
0.000 0.000 | 0.000 |
|||
| Plot | Lyso | Other | |||||||||||
| Expt C |
17 peptides |
1151 spectra |
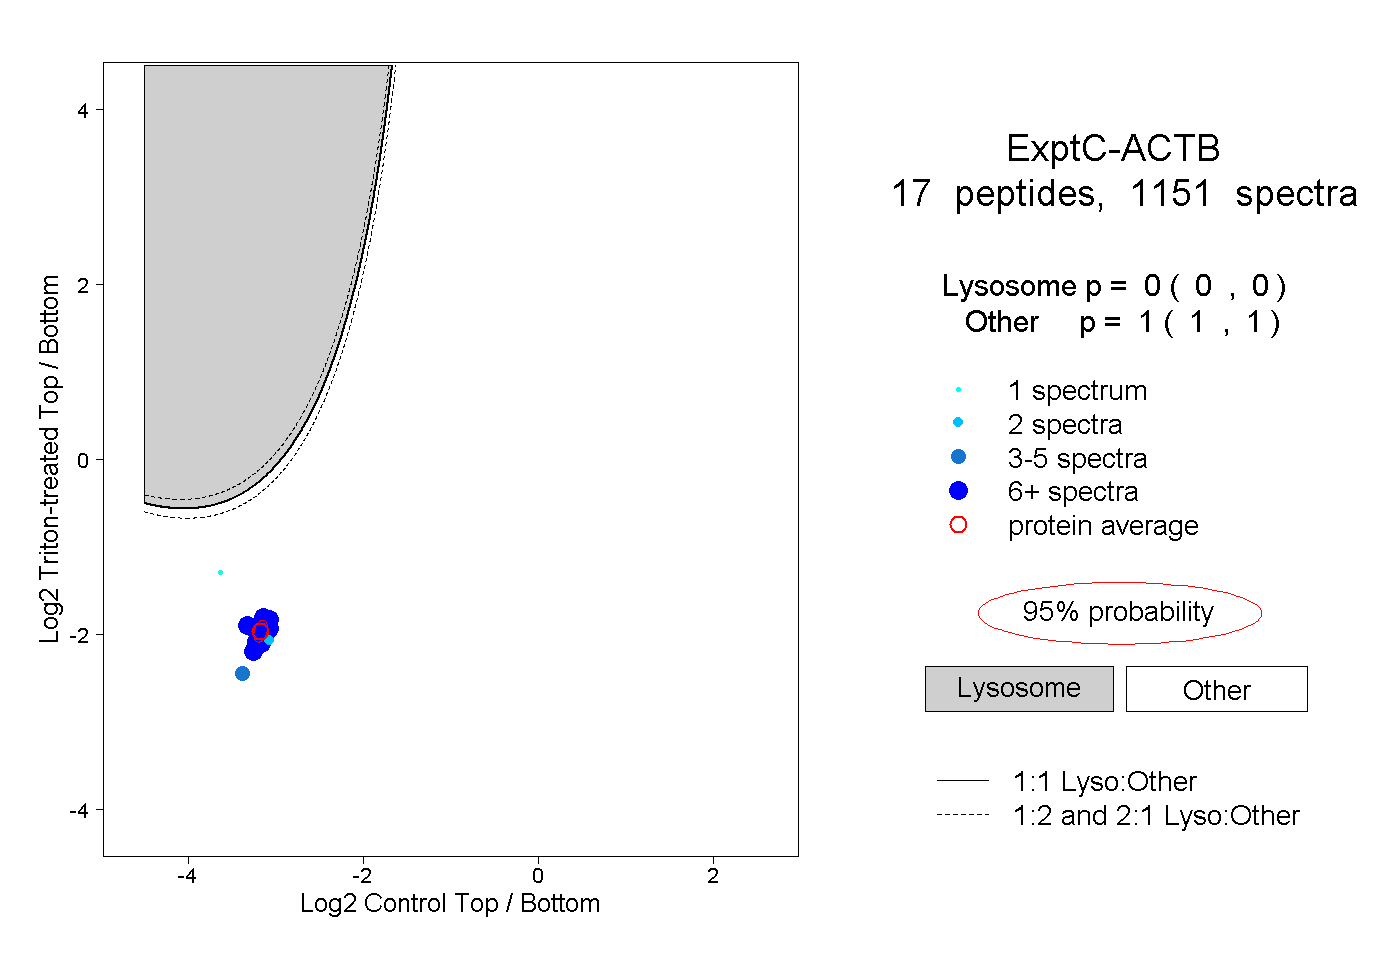 |
0.000 0.000 | 0.000 |
1.000 1.000 | 1.000 |
||||||||
| Plot | Lyso | Other | |||||||||||
| Expt D |
11 peptides |
42 spectra |
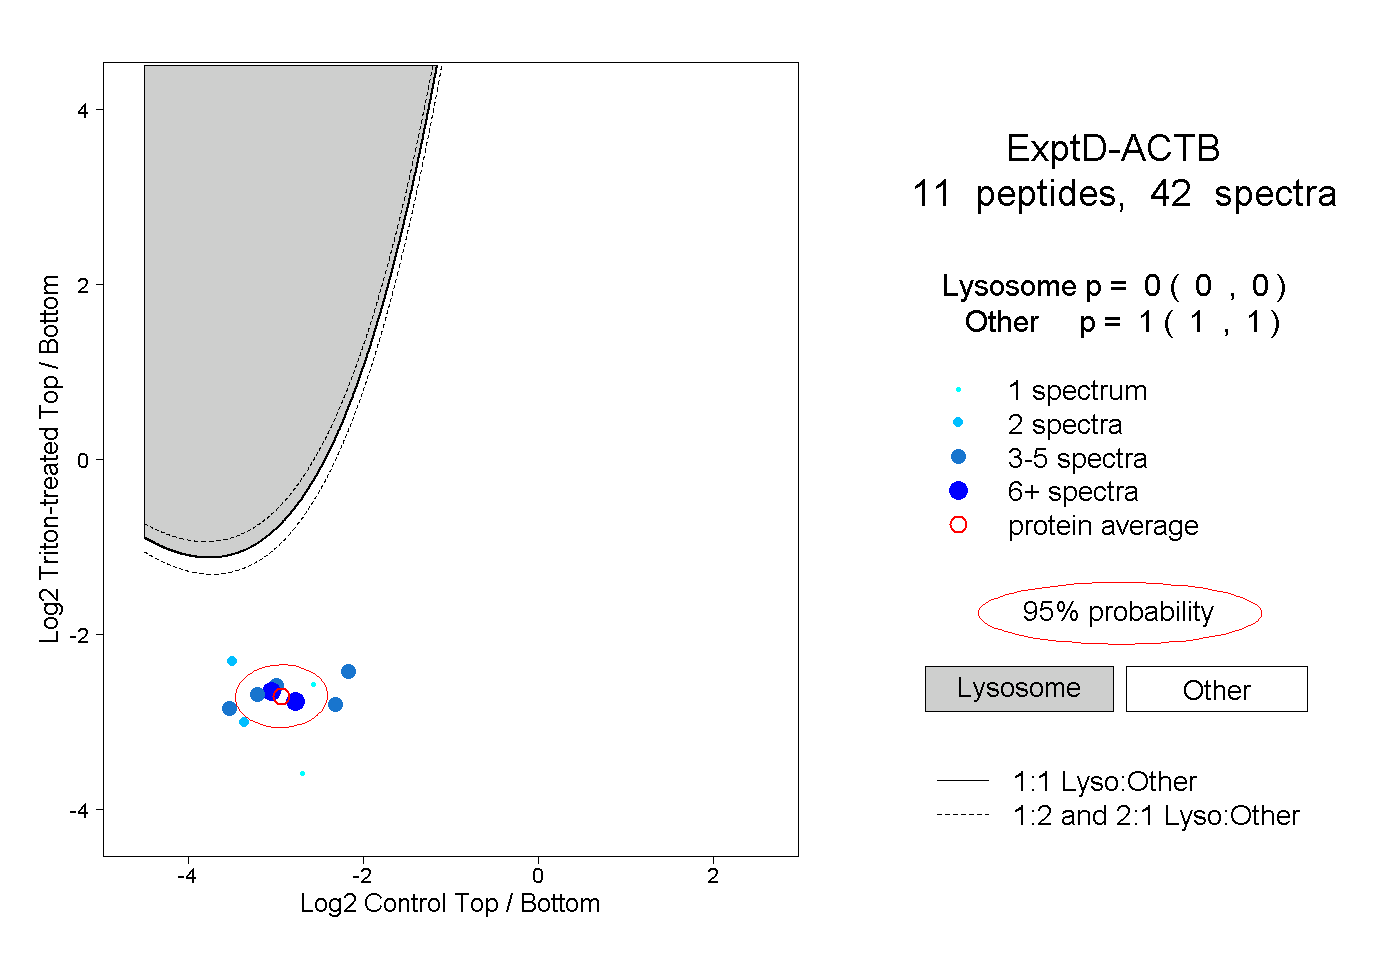 |
0.000 0.000 | 0.000 |
1.000 1.000 | 1.000 |